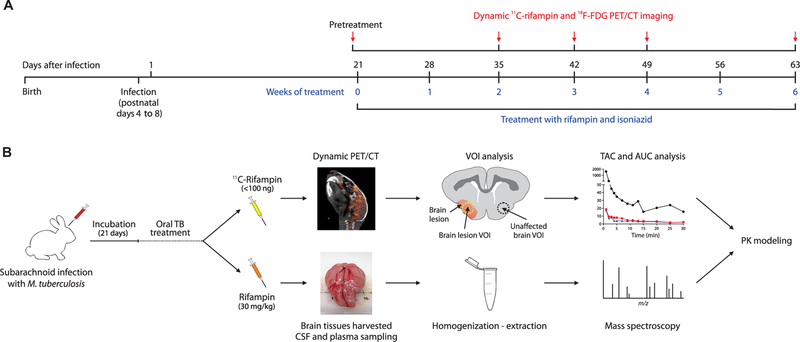
Fig. 1. Experimental timeline and schematic.

(A) Timeline of infection, antimicrobial treatment, and study procedures in rabbits. (B) 11C-rifampin for PET analysis (top) with three-dimensional (3D) volumes of interest (VOIs) drawn to measure the PET signal to generate time-activity curves (TACs) used to calculate AUC over 30 min (AUC0–30), or intravenous rifampin (bottom) for MS analysis. These results were used to develop a PK model to predict rifampin exposures in brain tissues. m/z, mass/charge ratio.
