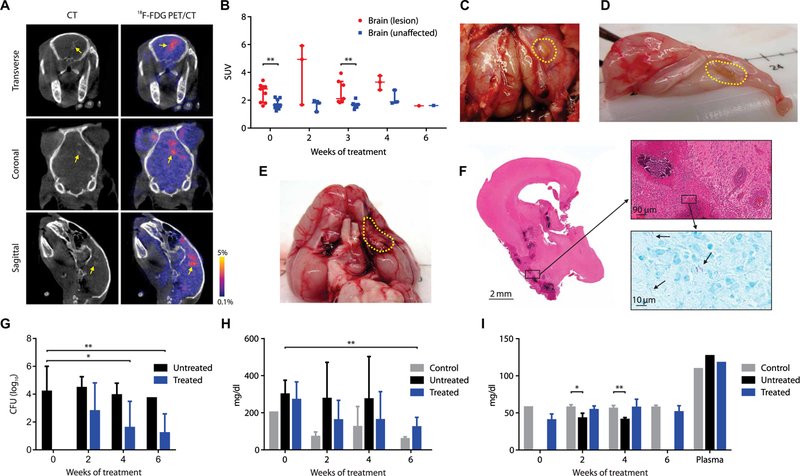
Fig. 2. Multidrug treatment in rabbits with experimentally induced TBM.

(A) Transverse, coronal, and sagittal images from a representative infected rabbit pretreat-ment (week 0). BL seen on CT (left panels, yellow arrow) and 18F-FDG PET signal (right panels). (B) Standardized uptake values (SUVs) for 18F-FDG PET during treatment (data represent three to nine VOIs from two to six animals at each time point except week 6, where one VOI from a single animal is shown). (C to E) Gross pathology demonstrating BLs (yellow dotted outline) from animals 7 to 9 weeks after infection. (F) Hematoxylin and eosin (magnification, ×1; top, ×20) and acid-fast (bottom inset, ×100) staining of brain tissues [from (E)]. (G) CFU in the brain tissues are shown on a logarithmic scale. At least five animals were used for each group and time point except at weeks 4 (n = 4; treated group) and 6 (n = 1; untreated group). (H) CSF total protein and (I) glucose concentration over the treatment duration are shown. Controls refer to uninfected animals. At least three animals were used for each group and time point except at week 0 for protein and glucose assays in the control group ( n = 2) and plasma glucose assays ( n = 1 per group). CFU and CSF data are presented as means ± SD with statistical comparisons performed using two-tailed Student’s t test. Imaging data are presented as median ± IQR with statistical comparisons performed using two-tailed Mann-Whitney U test. Statistical significance is represented by *P < 0.05 or **P < 0.01.
