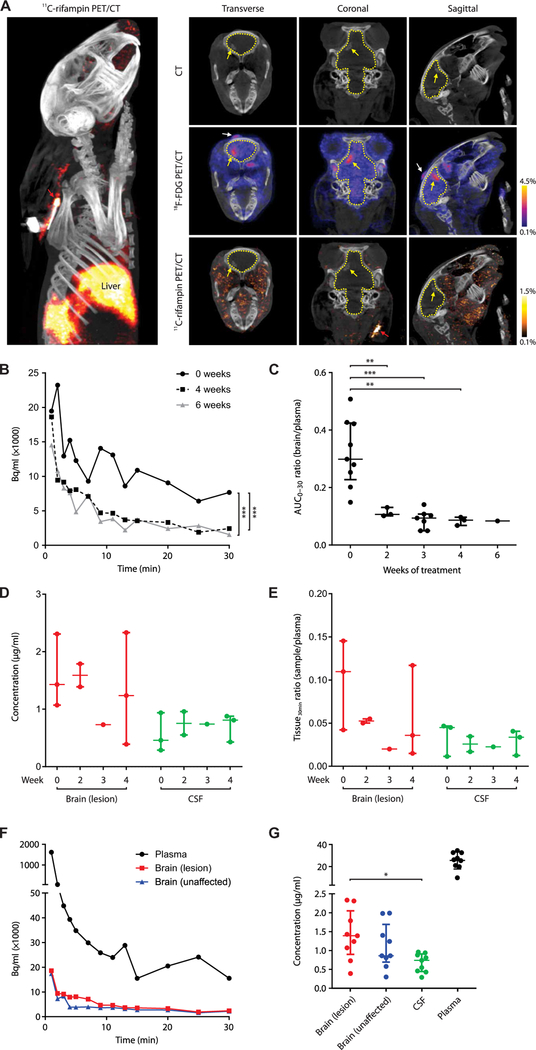
Fig. 3. Dynamic 11C-rifampin PET and rifampin MS.
(A) 3D reconstruction (left) and CT (top), 18 F-FDG PET/CT (middle), and 11C-rifampin PET/CT (bottom) images of the sagittal, coronal, and transverse sections of the brain of a representative infected rabbit at 4 weeks of treatment. Outline of the brain compartment (dotted yellow line), BL (yellow arrow), and site of injection (white arrow) are shown. (B) TACs demonstrating 11C-rifampin exposures (Bq/ml) over 30 min in a BL from one animal imaged pretreatment (week 0) and at 4 and 6 weeks into treatment (corrected for weight and tracer dose). (C) 11C-rifampin brain/plasma AUC0–30 ratios in BLs [data represent three to nine VOIs from two to six ani-mals at each time point except week 6, where one VOI from a single animal is shown]. (D) Rifampin concentration ( g/ml) and (E) tissue/plasma ratios (tissue30min ratio) from MS in postmortem samples at 30 min after rifampin intravenous dose at weeks 0 (n = 3 rabbits), 2 (n = 2), 3 (n = 1), and 4 (n = 3). (F) 11C-rifampin TAC from the same representative rabbit [from (A)]. (G) Rifampin concentration from all infected rabbits sampled (n = 9). Median and IQR are shown. *P < 0.05, **P < 0.01, and ***P < 0.001 by Wilcoxon signed rank test and two-tailed Mann-Whitney U test.

