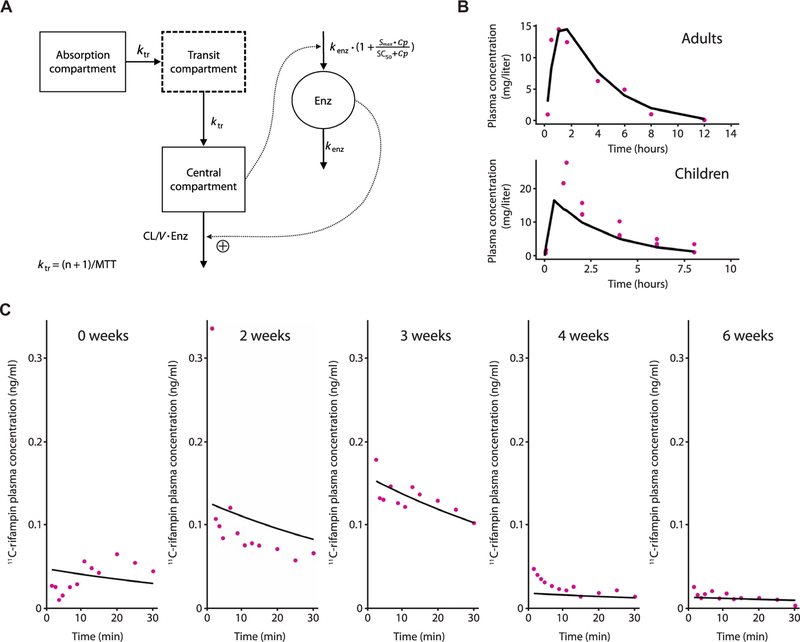
Fig. 5. Plasma 11C-rifampin and rifampin have sim-ilar PK characteristics.

(A) Schematic representation of the PK model of oral rifampin from (12). Mean transit time (MTT), clearance (CL), volume of distribution (V), maximal increase in the enzyme production rate (Smax ), rifampin concentration at which half the Smax is reached (SC50), and rate constant for first-order degradation of the enzyme pool (k enz). (B) Observed (purple dots) and model-predicted (black lines) rifampin plasma concentrations using digitized data from literature (table S4). (C) Ob-served (purple dots) and individual model predicted (black line) 11C-rifampin activity in plasma in represent ative TBM rabbits during treatment.
