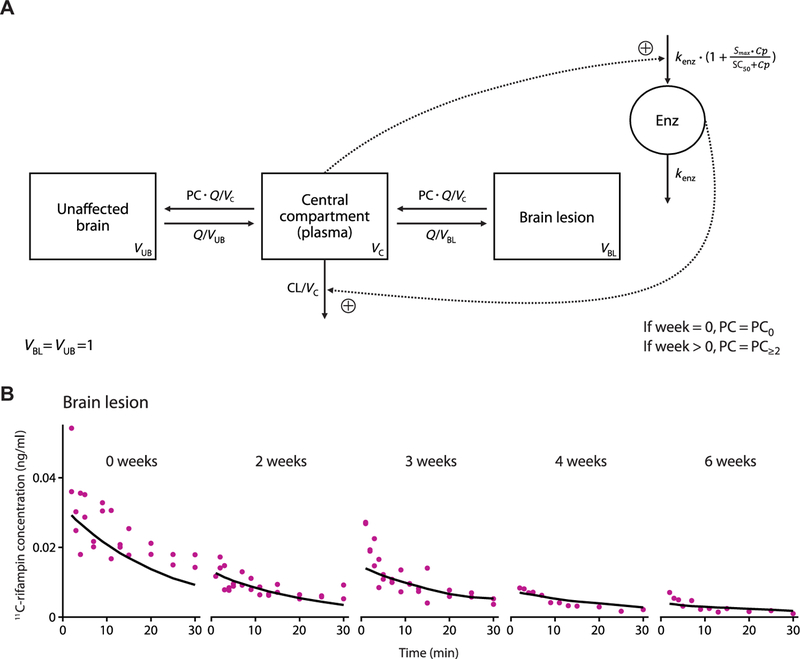
Fig. 6. PK–brain biodistribution rifampin model schematic and its goodness of fit in BLs.

(A) Schematic of the developed PK–brain biodistribution model describing the distribution of rifampin into UB and BLs. Parameters include clearance (CL) from the central compartment, volume of distribution (VC) of the central com-partment, clearance of unbound rifampin from plasma to UB or from plasma to BLs (Q), volume of distribution of UB (VUB), volume of distribution of BLs (VBL), partition/penetration coefficient (PC), partition/penetration coefficient at the start of treatment [week 0 (PC0)], partition/penetration coefficient beyond 2 weeks of treatment (PC≥2), MTT, maximal increase in the enzyme produc-tion rate (Smax), rifampin concentration at which half the Smax is reached (SC50), and rate constant for first-order degradation of the enzyme pool (kenz). (B) Observed (purple dots) and average PK model predicted (black lines) 11C-rifampin expo-sures in BLs in representative rabbits.
