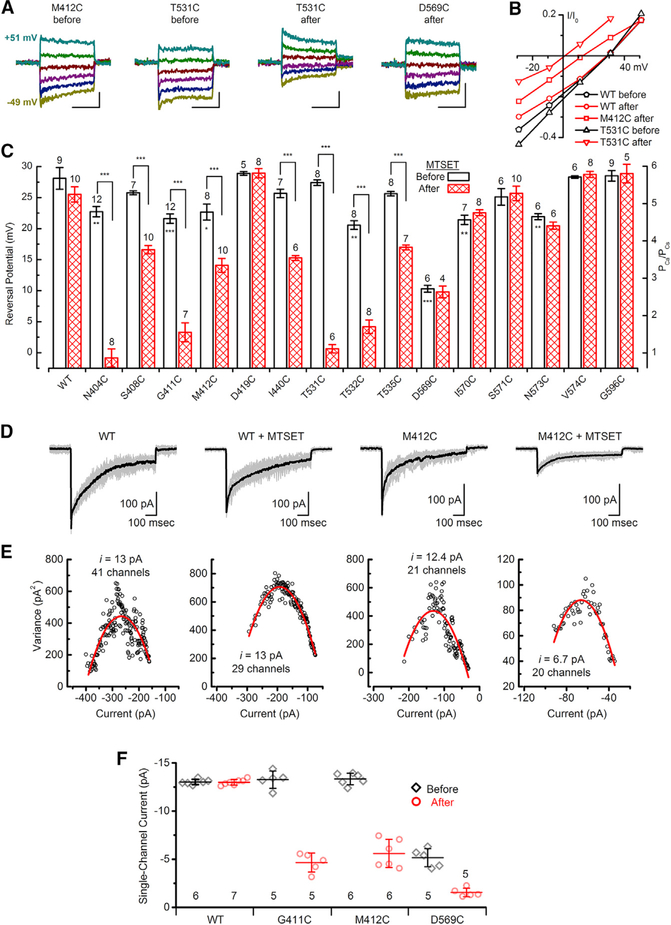
Figure 4. Reversal Potentials and Single-Channel Currents for WT TMC1 and Cysteine Mutants.
(A) Representative families of current evoked by 20-ms, 1-μm step hair bundle deflections measured at membrane potentials between −49 mV and 51 mV for IHCs expressing M412C, T531C, or D569C before or after MTSET as indicated. Cells were recorded with 100 mM Ca2+ extracellular and 140 mM Cs+ intracellular ion concentrations as the only charge carriers. The scale bars represent 10 ms (horizontal) and 25 pA (vertical).
(B) Current-voltage relationships were generated from the peak currents and plotted as function of membrane potential for the five TMC1 conditions indicated.
(C) Summary plots of mean (± SEM) reversal potentials for WT TMC1 and 15 cysteine mutants before and after treatment with 2 mM MTSET. Number of cells, from 2–4 mice/substitution, and the cysteine substitutions are indicated above and below each bar, respectively. Stars within bars indicate statistically significant differences relative to WT TMC1. Stars above brackets indicate statistically significant differences before and after MTSET. *p ≤ 0.05; **p ≤ 0.01; ***p ≤ 0.001; two population t tests.
(D) Mean sensory transduction current (black) for 14–28 individual current traces (gray) evoked by identical 1-μm bundle deflections for cochlear IHCs expressing WT TMC1 or M412C, before and after application of 2 mM MTSET.
(E) Plots of variance as a function of current amplitude (symbols) fitted with a parabolic function (red curve; see STAR Methods). Axes were adjusted to allow better visualization of the data and the quality of the fit.
(F) Mean (±SD) single-channel current estimates for WT and three mutants before and after application of MTSET. Number of cells, from 2 or 3 mice/substitution, is listed below.

