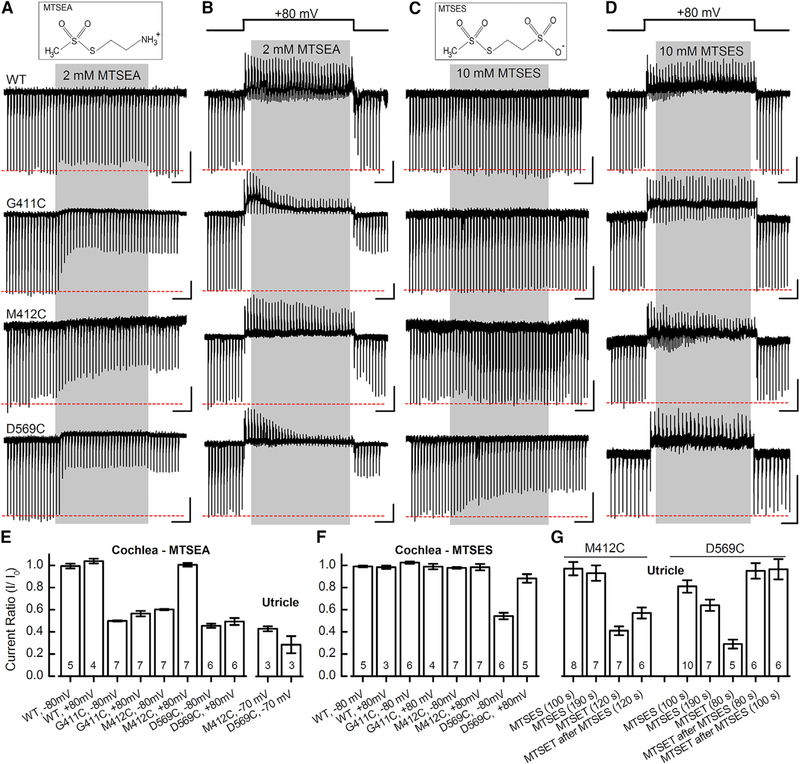
Figure 5. Effects of MTSEA and MTSES on WT TMC1 and Cysteine Mutants in IHCs and Vestibular Hair Cells.
(A) Structure of MTSEA (top). Sensory transduction currents recorded from IHCs during 10 s application of 2 mM MTSEA (gray) at −80 mV holding potential. The scale bars represent 2 s (horizontal) and 100 pA (vertical) for each trace (A–D).
(B) IHC currents recorded at +80 mV during 10 s application of 2 mM MTSEA (gray).
(C) Structure of negatively charged MTSES (top). Representative IHC currents after 10 s, 10 mM MTSES application (gray) at −80 mV are shown.
(D) IHC currents recorded at +80 mV during 10 s application of 10 mM MTSES (gray).
(E and F) Mean (± SEM) current ratios before and after 2 mM MTSEA (E) or 10 mM MTSES (F) application in cochlea IHC and utricle type II cells. Substitution, membrane potential, and number of cells, from 2–10 mice/condition, are indicated at the bottom.
(G) Mean (± SEM) current ratio for utricle type II cells expressing M412C or D569C after exposure to 10 mM MTSES alone or before 2 mM MTSET application. MTSES was applied for 80–190 s as indicated below.

