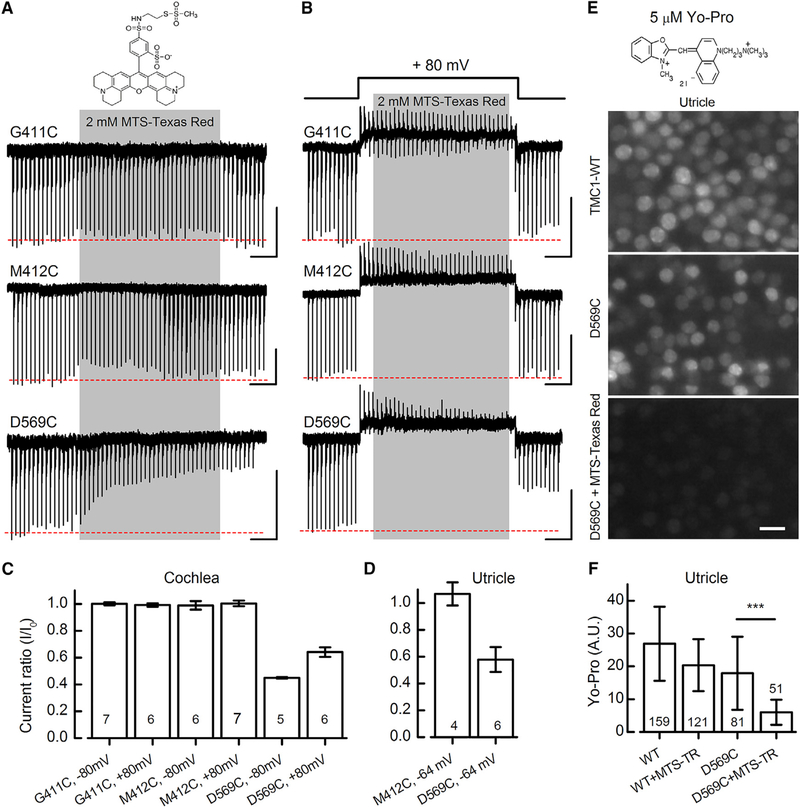
Figure 6. MTS-Texas Red Has Limited Access to G411C and M412C, but Not D569C.
(A and B) Structure of MTS-Texas Red (top). Transduction currents from IHCs after 10 s MTS-Texas Red application at −80 mV (A) and +80 mV (B) are shown. The scale bars represent 2 s (horizontal) and 100 pA (vertical).
(C and D) Summary plot of mean (± SEM) current ratios (I/I0) following exposure to MTS-Texas Red for cochlear IHCs (C) and utricle type II hair cells (D). Substitution, membrane potential, and number of cells, from 2–6 mice/condition, are shown below.
(E) Structure of YO-PRO-1 iodide (MW 629, top). Fluorescence images of YO-PRO-1 uptake in Tmc1/Tmc2 mutant utricle hair cells expressing WT TMC1 (top) or D569C (middle and bottom) are shown. The tissue was exposed to 5 μM YO-PRO-1 for 60 s followed by four bath exchanges during a five-minute wash. For the bottom panel, the tissue was exposed to 2 mM MTS-Texas Red for 60 s prior to application of YO-PRO-1. All images were acquired with identical gain and contrast settings. The scale bar represents 10 μm.
(F) Mean (±SD) YO-PRO-1 fluorescence quantified in A.U. (arbitrary units) for each condition shown at the bottom. Number of cells, from 2–3 mice/condition, is indicated in each bar. The experiment was replicated twice for WT tissue and three times for D569C. ***p = 1.3 × 10⁻¹¹ two population t test.

