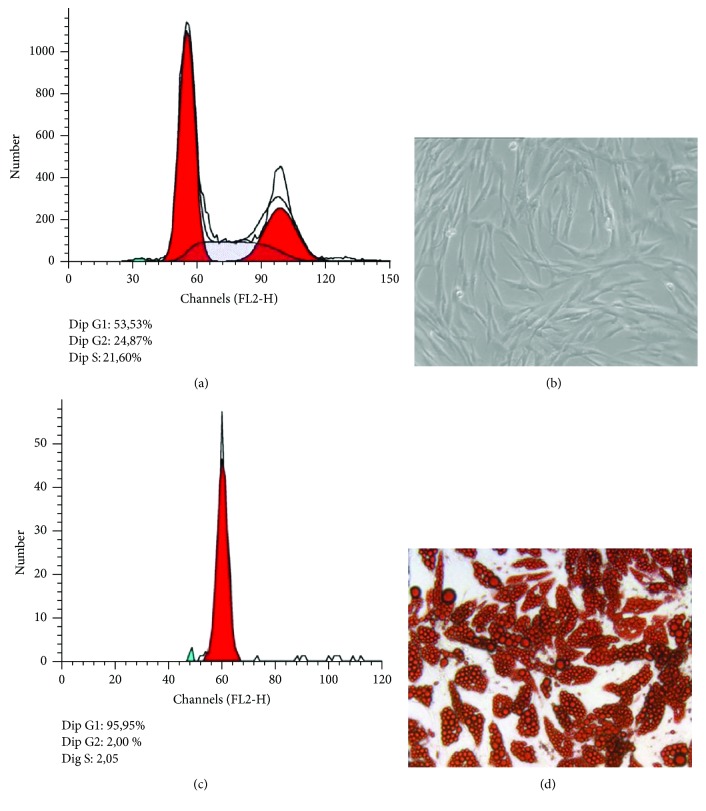
Figure 1.
Human preadipocytes SGBS cells: in panel (a) cytometric profile of cell cycle and in panel (b) optical photography. Differentiated human SGBS cells: in panel (c) cytometric profile of cell cycle and in panel (d) optical photography after stained with Oil Red O solution to display the accumulated lipid droplets. The acquired FACS data were analyzed by ModFit LT software.

