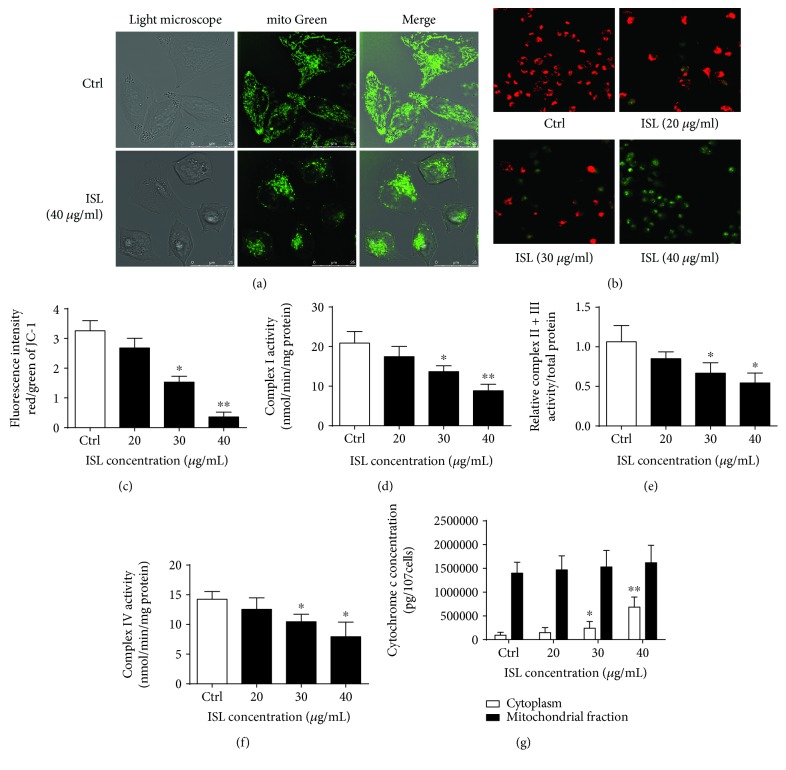
Figure 2.
ISL induces mitochondrial dysfunction in A375 melanoma cells. (a) Representative confocal images showing the fluorescent distribution of MitoTracker Green (excitation, 495 nm; emission, 535 nm) in A375 cells with or without ISL treatment. (b) Representative confocal images showing the fluorescent JC-1 probe in A375 cells treated with different concentrations of ISL. (c) Quantification of the JC-1 fluorescence intensity detected by flow cytometry. (d–f) Complex I–IV activity analysis in ISL-treated A375 cells. (g) Cytosolic and mitochondrial cytochrome c concentrations determined by enzyme-linked immunosorbent assay. ∗ P < 0.05 and ∗∗ P < 0.01 versus control.

