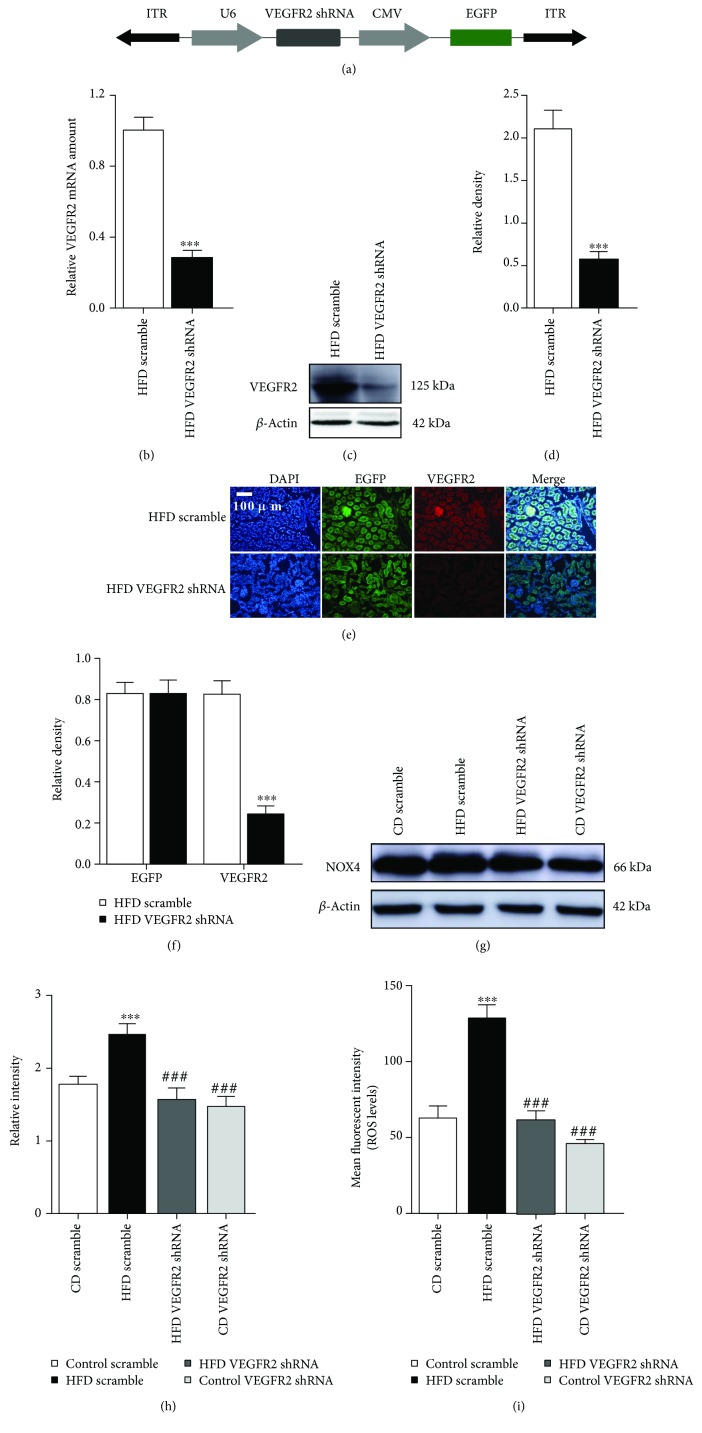
Figure 1.
Kidney-specific VEGFR2 knockdown inhibits renal oxidative stress of the HFD-treated mice. (a) Schematic representation of the AAV used in this study. (b) VEGFR2 mRNA were determined by real time qPCR. Values are expressed as the ratio of VEGFR2 to GAPDH. ∗∗∗ p < 0.001 vs. the HFD scramble group. (c) Representative immunoblots for VEGFR2 and β-actin. (d) Relative density analysis of VEGFR2 protein bands. Relative densities are expressed as the ratio of VEGFR2 to β-actin. ∗∗∗ p < 0.001 vs. the HFD scramble group. (e) Kidney sections were stained with EGFP and CY3 (green) and VEGFR2 (red) to visualize AAV2/9-infective cells, respectively (200x, scale bar, 100 μm). (f) Analysis of the relative intensity of EGFP-positive and VEGFR2-positive cells in the kidney sections, ∗∗∗ p < 0.001 vs. the HFD scramble group. (g) Representative immunoblots for NOX4 and β-actin. (h) Relative density analysis of NOX4 protein bands. Relative densities are expressed as the ratio of NOX4 to β-actin. ∗∗∗ p < 0.001 vs. the CD scramble group, and ### p < 0.001 vs. the HFD scramble group. (i) ROS levels were assessed by 2′,7′-dichlorofluorescein diacetate (DCF-DA). All values are expressed as mean ± SEM ((b–i), n = 5). ∗∗∗ p < 0.001 vs. the CD scramble group, and ### p < 0.001 vs. the HFD scramble group.

