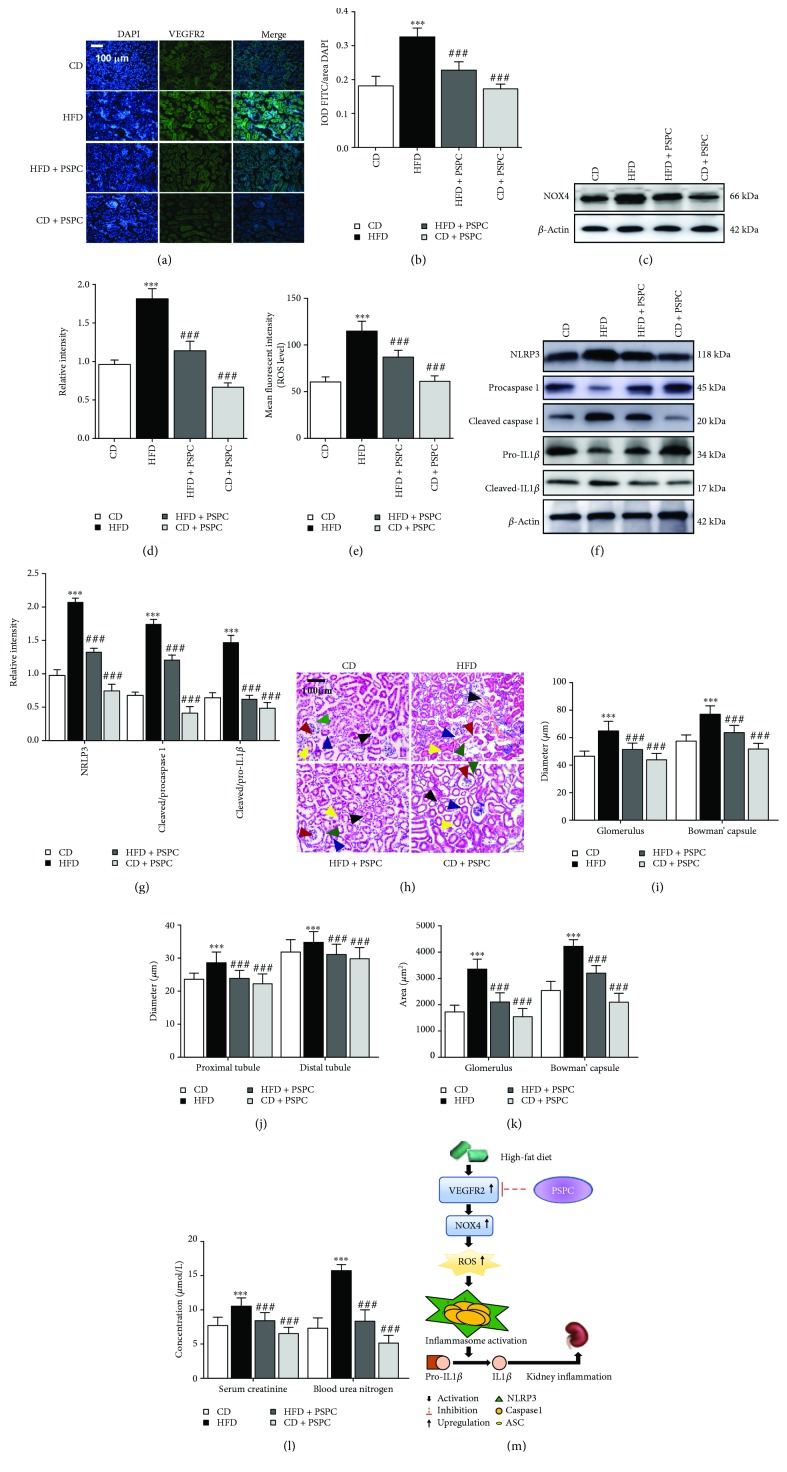
Figure 6.
PSPC administration inhibits ROS-triggered NRLP3 inflammation in HFD-treated mice. (a) Kidney sections were stained with FITC to visualize VEGFR2-positive cell staining (green) (200x, scale bar, 100 μm). (b) Analysis of the relative intensity of VEGFR2-positive cells in the kidney sections. (c) Representative immunoblot for NOX4 and β-actin. (d) Relative density analysis of the NOX4 protein bands. Relative densities are expressed as the ratio of NOX4 to β-actin. (e) The ROS levels were assessed by 2′,7′-dichlorofluorescein diacetate (DCF-DA) in the kidney of HFD-treated mice. (f) Representative immunoblots for NLRP3, procaspase 1, cleaved caspase 1, pro-IL1β, cleaved IL1β, and β-actin. (g) The relative density analysis of the NLRP3, cleaved caspase 1, and cleaved IL1β protein bands. The relative densities are expressed as the ratio of NRLP3 to β-actin, cleaved caspase 1 to procaspase 1 (expressed as cleaved/procaspase 1), and cleaved IL1β to pro-IL1β (expressed as cleaved/pro-IL1β). All values are expressed as mean ± SEM ((a–g), n = 5). ∗∗∗ p < 0.001 vs. the CD group, and ### p < 0.001 vs. the HFD group. (h) Kidney sections were stained by hematoxylin-eosin; the black arrow represents the accumulation of inflammatory cells in the kidney (200x, scale bar, 100 μm). (i) Glomerulus and Bowman's capsule diameter were determined by Image-Pro Plus (IPP); the red arrow represents blood glomerulus, and the green arrow represents Bowman's capsule. (j) Tubule diameter was measured by IPP; the blue arrow represents proximal tubules, and the yellow arrow represents the distal tubules. (k) Glomerulus and Bowman's capsule area were determined by IPP. (l) Serum creatinine and blood urea nitrogen determination. (m) Schematic diagram of PSPC on VEGFR2/ROS/NRLP3 signaling in the kidney of HFD-treated mice. All values are expressed as mean ± SEM ((a–e), n = 5). ∗∗∗ p < 0.001 vs. the CD group, and ### p < 0.001 vs. the HFD group.

