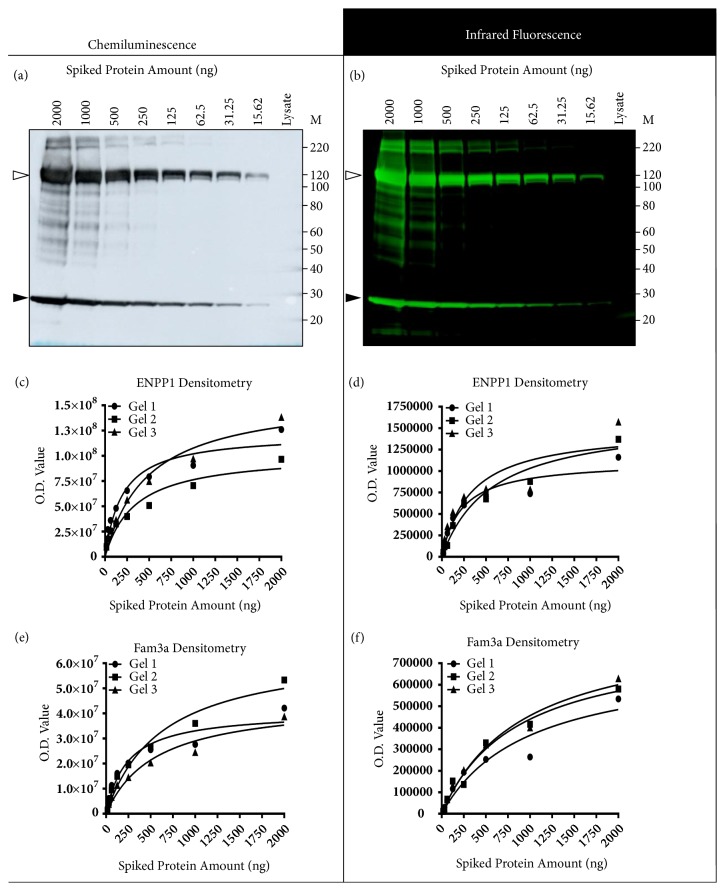
Figure 4.
Densitometry analyses and representative Western blots of lysates spiked with recombinant proteins. (a) Representative blot detected using chemiluminescence. (b) Representative blot detected using infrared fluorescence. In both images the top band at approximately 120 kDa is recombinant ENPP1 (open arrow) and the bottom band at approximately 25 kDa is recombinant Fam3a (closed arrow). MagicMark XP was used for sizing (not shown). (c) ENPP1 O.D. values in membranes detected with chemiluminescence. (d) ENPP1 O.D. values in membranes detected with infrared fluorescence. (e) Fam3a O.D. values in membranes detected with chemiluminescence. (f). Fam3a O.D. values in membranes detected with infrared fluorescence. 3 independently prepared membranes were used for each detection method.

