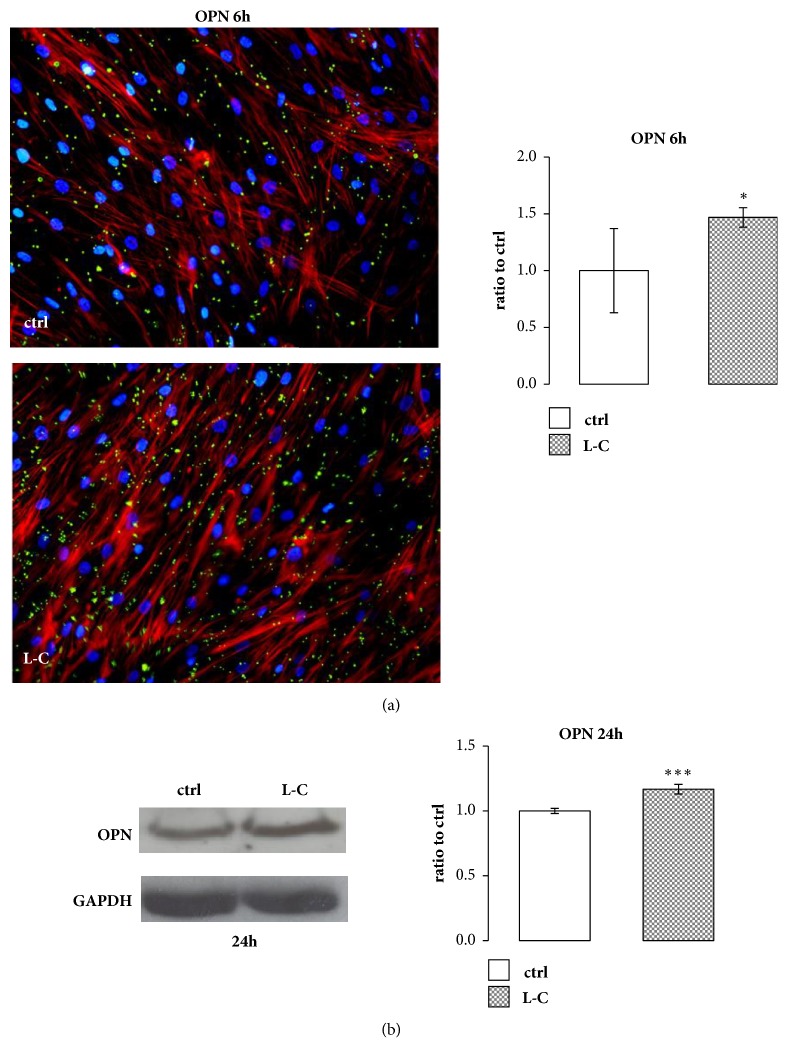
Figure 6.
L-Carnitine (L-C) effect on OPN protein. (a): Immunofluorescence staining of OPN protein after 6h of 5 mM L-C treatment and relevant quantification showed an increase in OPN protein level compared to control (ctrl). Osteoblastic morphology was analyzed by Phalloidin (red) and OPN (green) staining. The quantified signal was normalized for the total nuclei number (magnification: 20X). (b): Representative Western blot and relevant quantification of OPN protein content increased after 24h of 5 mM L-C stimuli. Data are the mean ± SD of six to nine experiments performed with cells obtained from different donors. Student's t test: ∗p<0.05, ∗∗∗p<0.001 vs control (ctrl).

