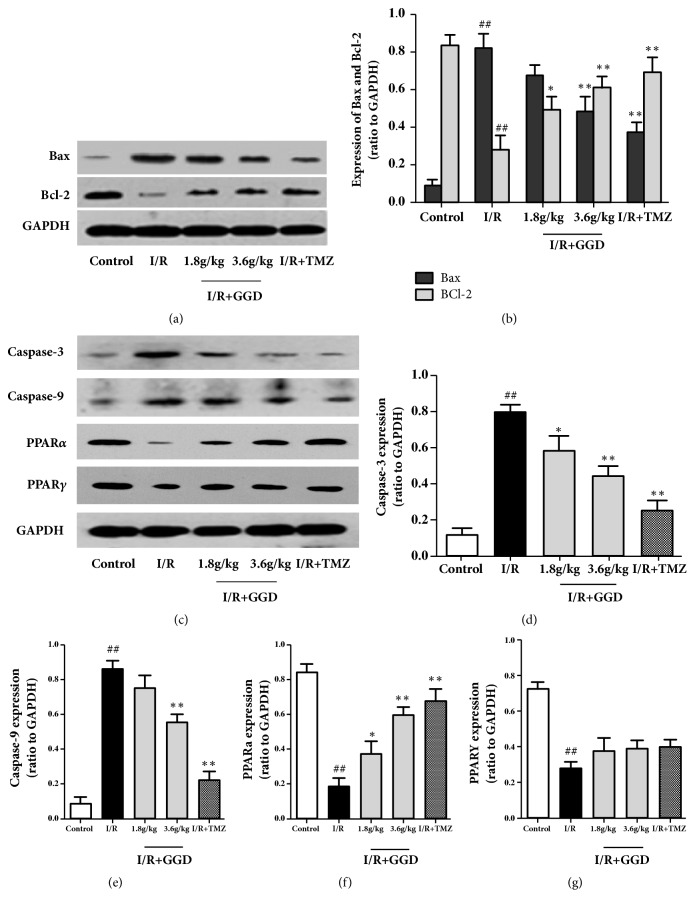
Figure 4.
Effect of GGD treatment on expressions of apoptosis-related proteins in each group as detected by Western blot. (a,c) Representative immunoblots of samples from rat ventricles subjected to different treatments. (b, d–g) Quantitative densitometric analysis of Bax, Bcl-2, caspase-3, caspase-9, PPARα, and PPARγ, with GAPDH as an internal control. Values were presented as mean±SEM. n=4; #P<0.05 and ##P<0.01 compared with control group; ∗P<0.05 and ∗∗P<0.01 compared with I/R group.

