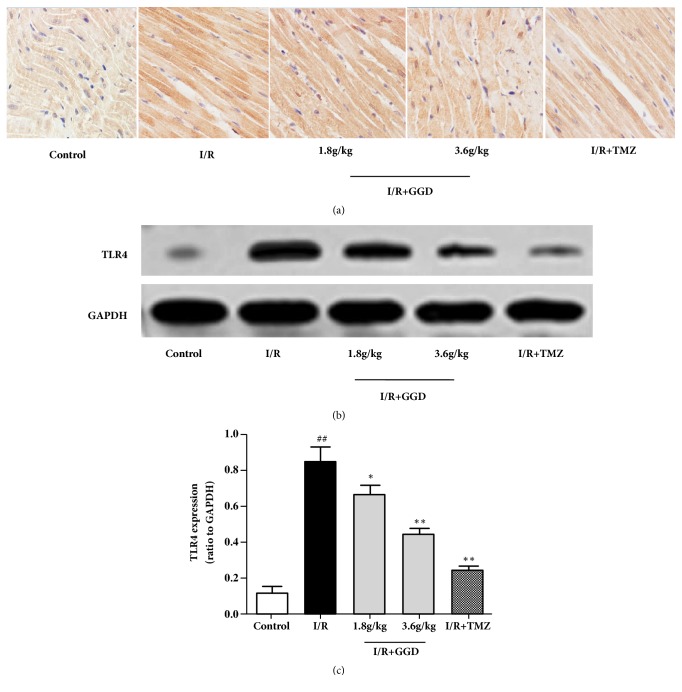
Figure 5.
Effect of GGD treatment on myocardial TLR4 expression in each group. (a) Representative immunohistochemistry of TLR4 from rat ventricles. The brown color in the cytoplasm represents the expression of TLR4. Photomicrographs were taken at ×400. (b) Representative immunoblots of samples from rat ventricles subjected to different treatments. (c) Quantitative densitometric analysis of TLR4 protein with GAPDH as an internal control. Values were presented as mean±SEM. n=4; #P<0.05 and ##P<0.01 compared with control group; ∗P<0.05 and ∗∗P<0.01 compared with I/R group.

