Fig. 5.
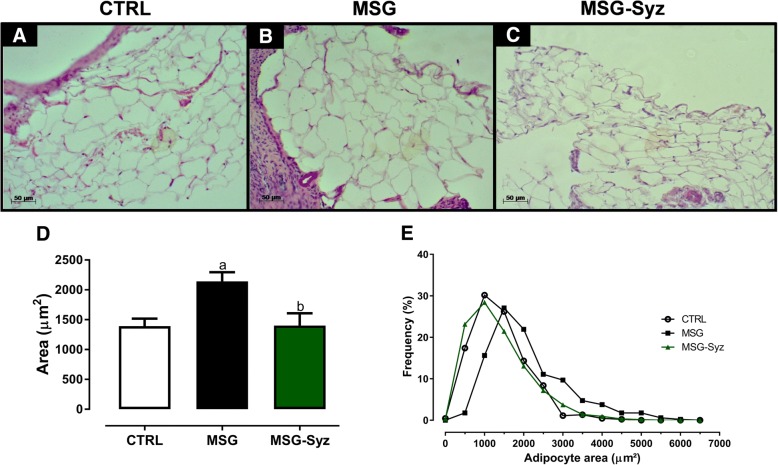
Periovarian adipocyte hypertrophy found in MSG rats is reversed by HESc treatment. Periovarian fat deposits were collected at the end of treatment and processed together with ovaries. These were then stained with HE and visualized under an optical microscope with a 200x magnification. Representative sections of CTRL (a), MSG (b) and MSG-Syz (c). d: Average area of periovarian adipocytes. e: Frequency of distribution of periovarian adipocyte area; the area of at least 55 adipocytes was measured in 2–3 different randomly selected fields. Values are expressed as mean ± S.E.M, n = 7–9. (p < 0.05) a: vs CTRL; b: vs MSG

