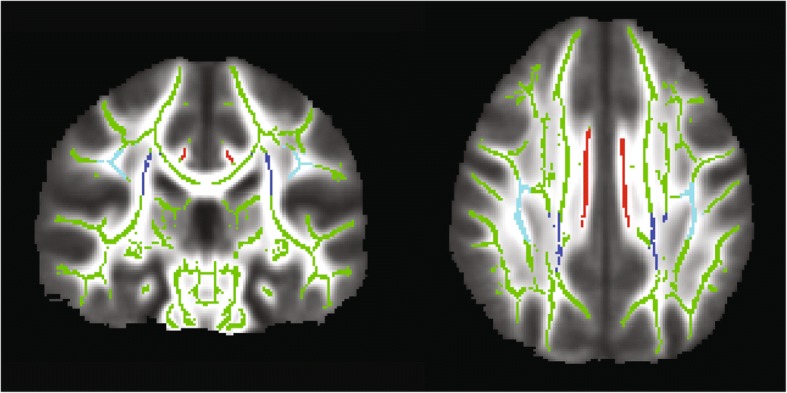
Fig. 1.

Skeletonized map of FA tracts. Image of the FA skeleton mask (green) displaying the tracts with significantly lower FA in the AOR group: the bilateral posterior corona radiata (PCR, dark blue), superior longitudinal fasciculus (SLF, light blue), and the cingulate gyrus-cingulum portion (CGC, red)
