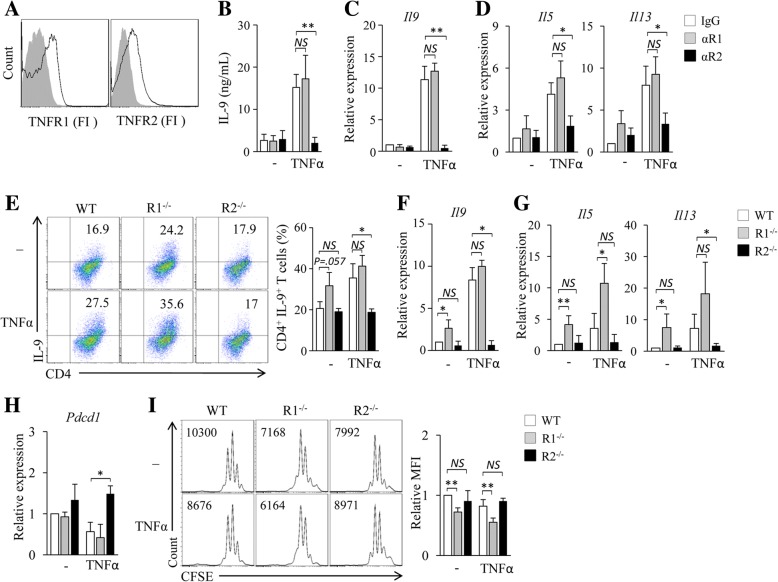
Fig. 4.
TNF-α enhances Th9 cell differentiation through TNFR2 but not TNFR1. (a) Flow cytometry examined analysis of TNFR1 and TNFR2 in mouse CD4+ T cells. (b-d) CD4+ naïve T cells were cultured under Th9 polarizing conditions in the presence of TNFR1 (αR1) or TNFR2 (αR2) blocking antibodies or an isotype control IgG (IgG) with or without (−) addition of TNF-α for 3 days. (b) ELISA assessed IL-9 secretion in the culture. (c, d) qPCR assessed the expression of Il9 (c) and Il5 and Il13 (d) in CD4+ T cells. (E-H) Naïve CD4+ T cells were isolated from wild type (WT), TNFR1−/− (R1−/−) or TNFR2−/− (R2−/−) mice and cultured under Th9 polarizing conditions with or without addition of TNF-α for 3 days. (e) Flow cytometry analysis of IL-9+CD4+ T cells. Numbers in the dot plots represent the percentages of IL-9+CD4+ T cells. Right, summarized results of three independent experiments obtained as at left. (f, g) qPCR analysis of Il9 (f), Il5 and Il13 (g) in CD4+ T cells. (h) qPCR analysis of Pdcd1 in T cells. (i) Naïve CD4+ T cells from WT, R1−/− and R2−/− mice were labeled with CFSE and cultured under Th9 polarizing conditions with or without the addition of TNF-α for 3 days. Flow cytometry analyzed CFSE-stained T cells. Numbers in the histograms represent the fluorescence intensity of CFSE-stained T cells. Right, summarized results of three independent experiments obtained as the left. Data are representative of three (a, e, i) independent experiments or presented as mean ± SD of three (b-i) independent experiments. NS, non-significant; *P < 0.05; **P < 0.01

