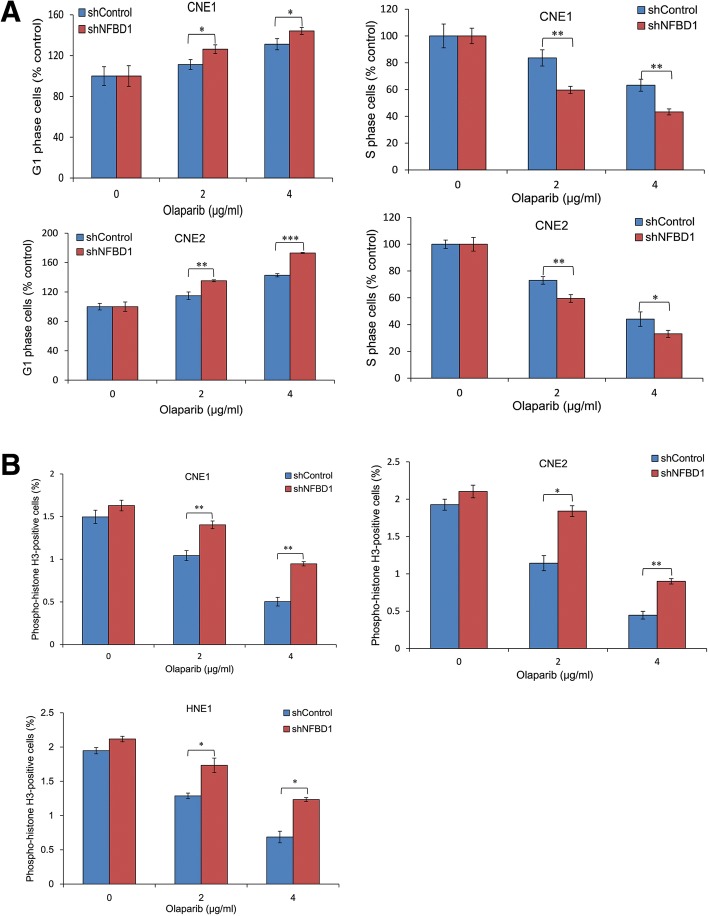
Fig. 3.
The effects of olaparib on cell cycle distribution. NPC cells were treated with various concentrations of olaparib for 24 h, (a) the cell cycle distribution was determined by FCM, and (b) mitotic cells were determined by phospho-histone H3 staining and FCM. Data shown are mean ± SD from three independent experiments. *P < 0.05**, P < 0.01 and ***P < 0.001

