Fig. 7.

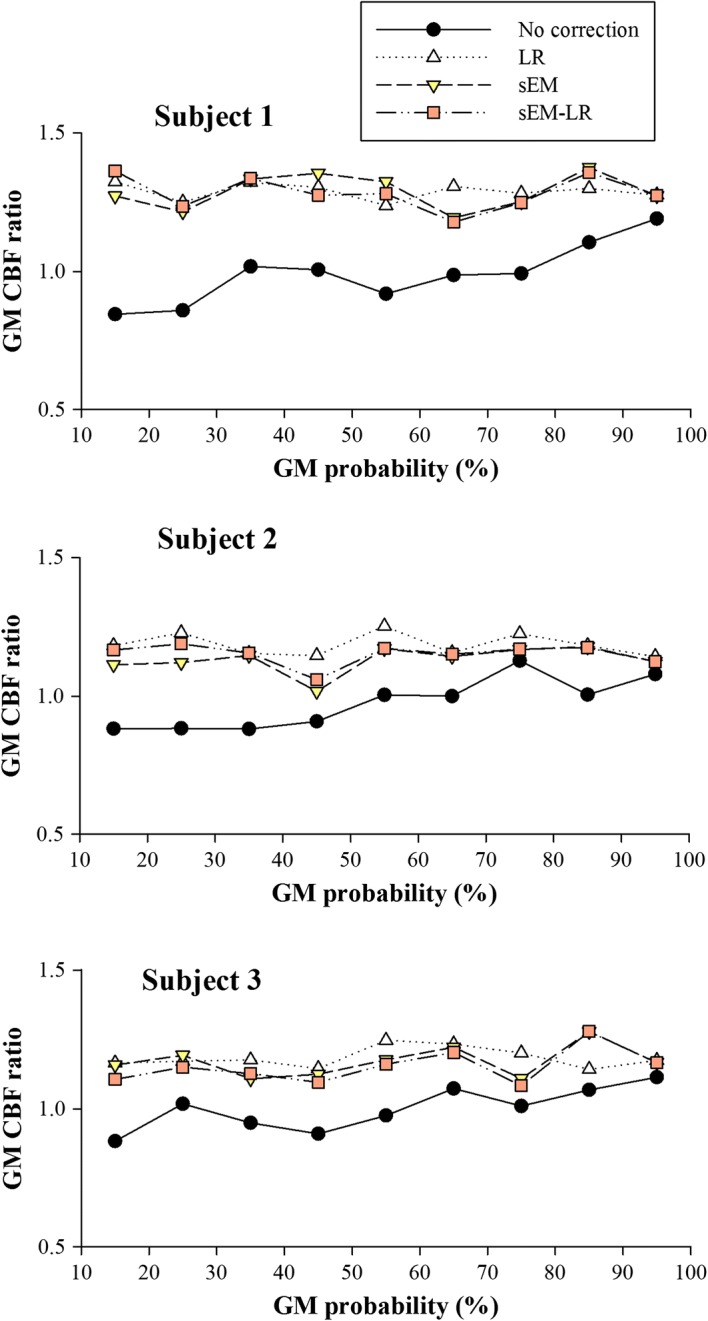
ROI analysis for three healthy subjects shown in Fig. 6; each data point represents the mean GM CBF for all voxels falling within a 10 percentile range of the GM probability. From top to bottom: each healthy subject for in vivo data

ROI analysis for three healthy subjects shown in Fig. 6; each data point represents the mean GM CBF for all voxels falling within a 10 percentile range of the GM probability. From top to bottom: each healthy subject for in vivo data