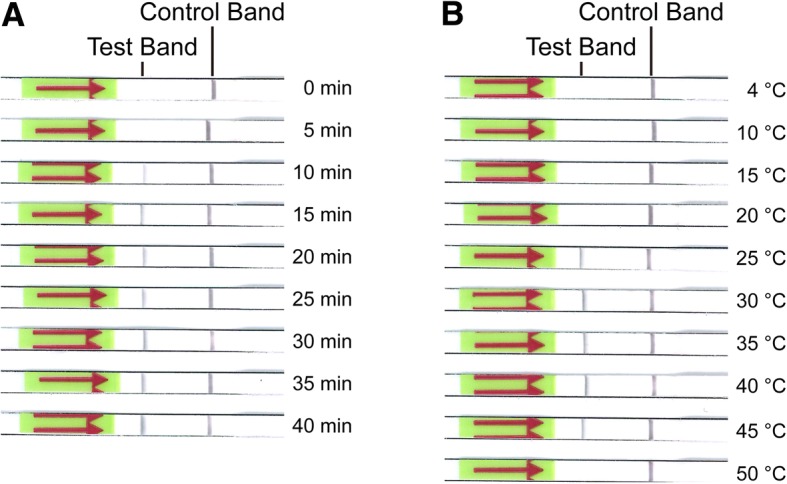
Fig. 3.

Analysis of optimal amplification time and temperature. The amplification time (a) and temperature (b) were shown on the right. 0.64 pg of genomic DNA of C. neoformans var. grubii H99 (ATCC 208821) was used as templates. a amplification time. A clear test band appeared and became more solid as time extended to 10 min or more. b amplification temperature. An obvious test band could be seen over a wide range of temperature from 25 to 45 °C.
