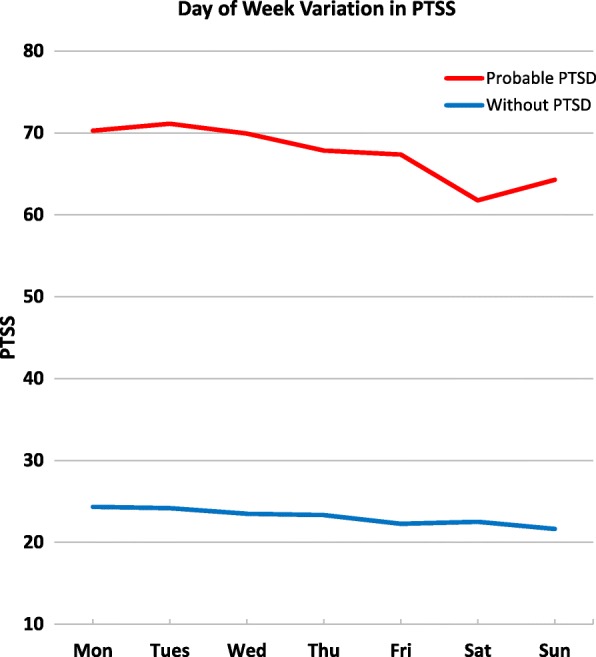
Fig. 1.

Day of Week Difference in PTSS in Participants with and without Probable PTSD. Note. Least squares means were obtained by estimating PTSS adjusting for demographic characteristics, including gender, age, race, and education. PTSS varied across the seven days among participants with probable PTSD, F(6, 228) = 3.05, p = .007, but not among those without PTSD, F(6, 215) = 0.82, p = .559
