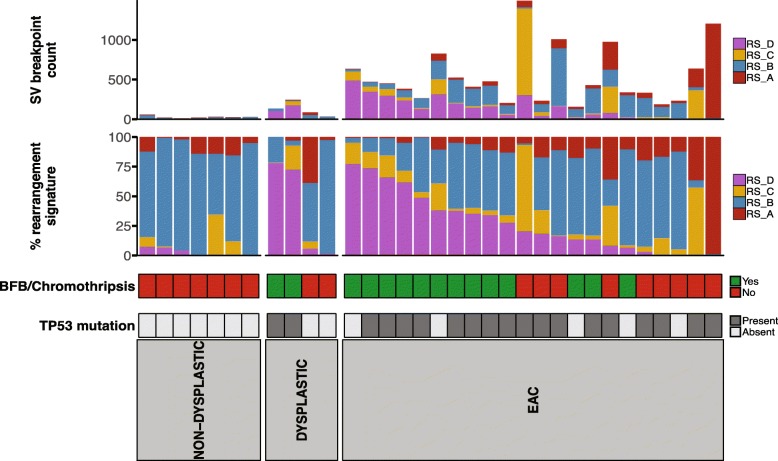
Fig. 3.
Contribution of rearrangement signatures to BE and EAC samples. The upper barchart shows the number of SV breakpoints and the contribution of the four rearrangement signatures to each sample. The lower barchart shows the contribution of each signature as a percentage. The presence of complex events that resemble BFB or chromothripsis and TP53 mutations is also shown. Non-progressor samples and one dysplastic sample are not shown due to having too few SV events to be used to identify signatures. Sample order for the figure can be found in Additional file 2: Table S1c

