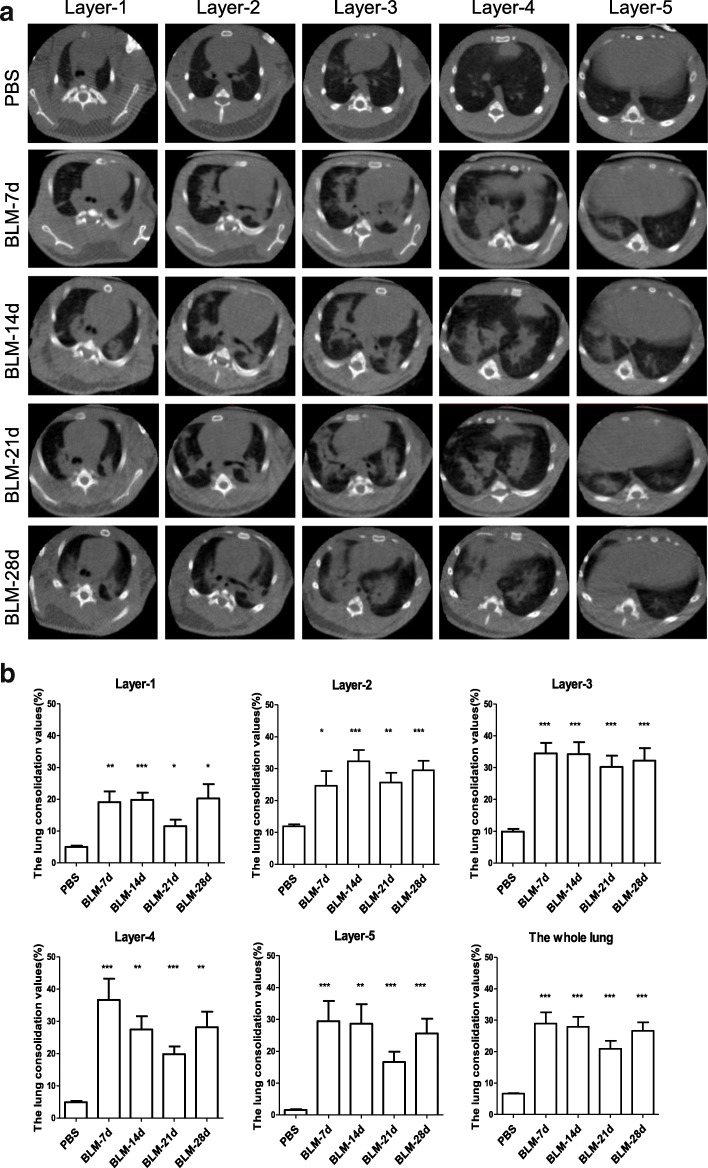
Fig. 2.
Respiratory ungated micro-CT on days 7, 14, 21 and 28 at five different layers after intratracheal bleomycin administration. a Typical micro-CT images of a guinea pig at different time points. b The values of the lung consolidation at the different layers with corresponding time points (n = 6~7). *p < 0.05, **p < 0.01, *** p < 0.001, vs. PBS group

