Figure 2.
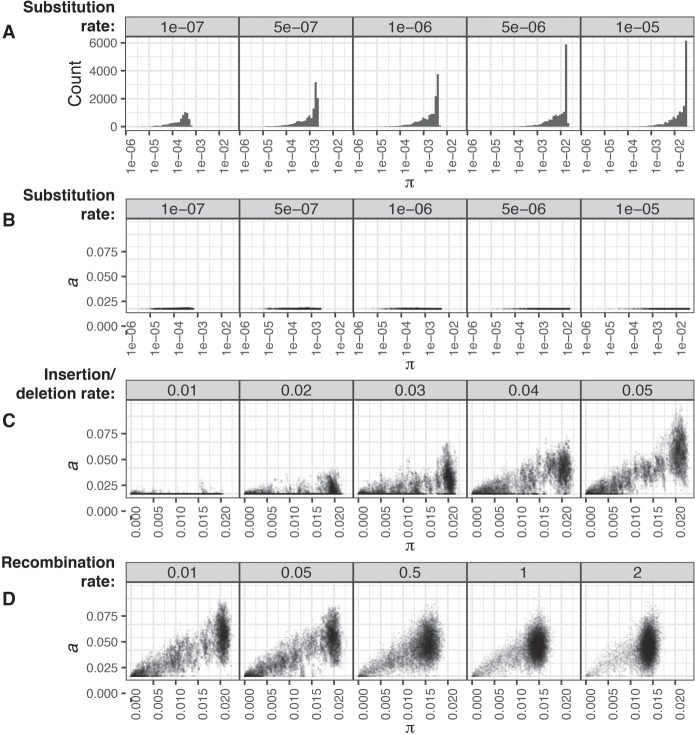
Detection of genetic diversity in simulated populations by PopPUNK. Each plot shows the deviation in gene sequence (π) and gene content (a) estimated by PopPUNK from a sample of 25 isolates from each of 50 simulations run with the same parameters. (A,B) Deviation through point mutation only. As the rate of point mutation (base−1 generation−1) was increased over two orders of magnitude, estimates of population-wide π increased accordingly, as shown by the distribution of pairwise core distances in the top row of histograms (A). The scatterplots below (i.e., in B) show that a measurements remained below 5 × 10⁻³, demonstrating the specificity with which divergence was measured. (C) Deviation through insertions and deletions. To test the estimation of a in a clonally evolving population, simulations included insertions and deletions of 100-bp segments occurring at a rate defined relative to the fixed point mutation rate of 5 × 10⁻⁶ base−1 generation−1. Estimates of a increased proportionately with this rate, without affecting the observed range of π. (D) Effects of recombination on the distribution of genetic diversity. With the insertion and deletion rate fixed at 0.05 relative to the point mutation rate of 5 × 10⁻⁶ base−1 generation−1, the rate of recombination relative to point mutations was then varied. This resulted in a concentration of the estimated distances into a single mode, representing the changing population structure as frequent exchange between isolates homogenizes the divergence between them in both gene sequence and content.

