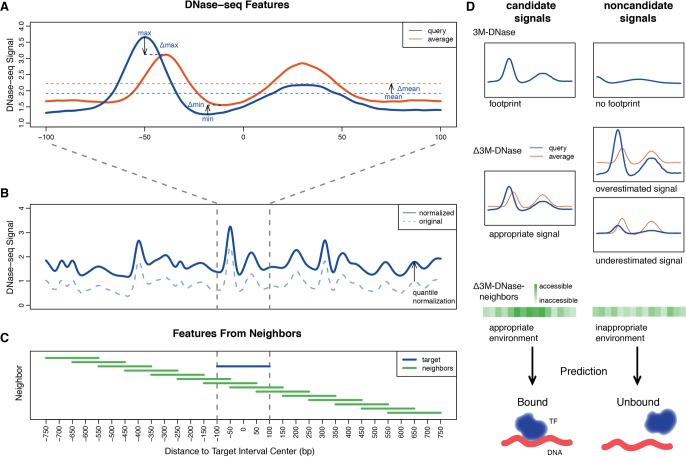
Figure 3.
Processing DNase-seq signals to limit cell-type–specific biases. (A) For each 200-bp genomic interval, the maximum, minimum, and mean and the Δmaximum, Δminimum, and Δmean DNase-seq values are extracted as features to correct for the heterogeneity of DNase-seq signals and eliminate local sequencing biases. (B) The dashed original DNase-seq profile is quantile normalized to the test cell type profile to eliminate the cell-type–specific biases. (C) The features from 15 intervals ranging between upstream and downstream 750 bp are considered to capture the neighboring chromatin accessibility. (D) Example scenarios of candidate and noncandidate signals captured by 3M-DNase, Δ3M-DNase, and Δ3M-DNase-neighbors features.

