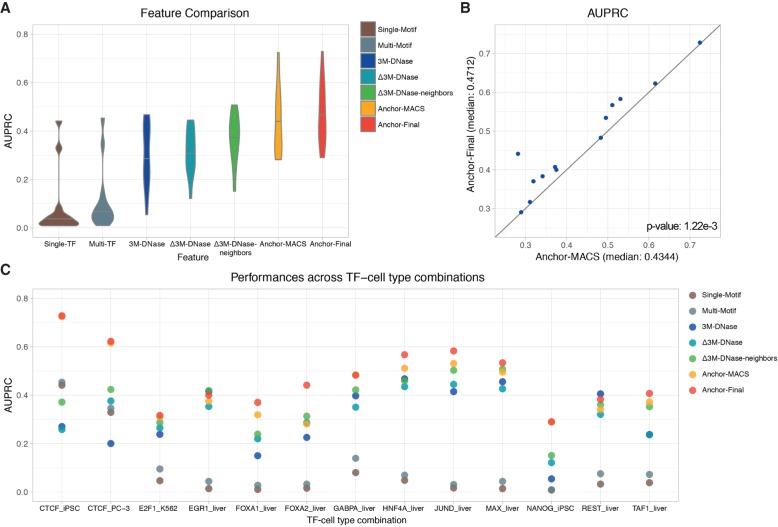
Figure 4.
The performance comparison of models using different features in 13 testing TF-cell type pairs. The prediction performances of two sequence-based models (Single-Motif and Multi-Motif), three DNase-based models (3M-DNase, Δ3M-DNase, and Δ3M-DNase-neighbors), and two ensemble models (Anchor-MACS and Anchor-Final). (A) The median AUPRCs of models using different types of features across 13 TF-cell type pairs. (B) The AUPRCs of the Anchor-MACS (x-axis) and Anchor-Final (y-axis) models in 13 TF-cell type pairs are shown as blue dots. If a dot is above the diagonal line, it means the AUPRC of the Anchor-Final model is higher. The paired Wilcoxon signed-rank test was performed between the predictions of these two models and the P-value= 1.22 × 10⁻³. (C) The AUPRCs of 13 TF-cell type pairs using different types of features. Some yellow dots are covered by the red dots, due to similar performances. The complete listing of the AUPRCs can be found in Supplemental Table S8.

