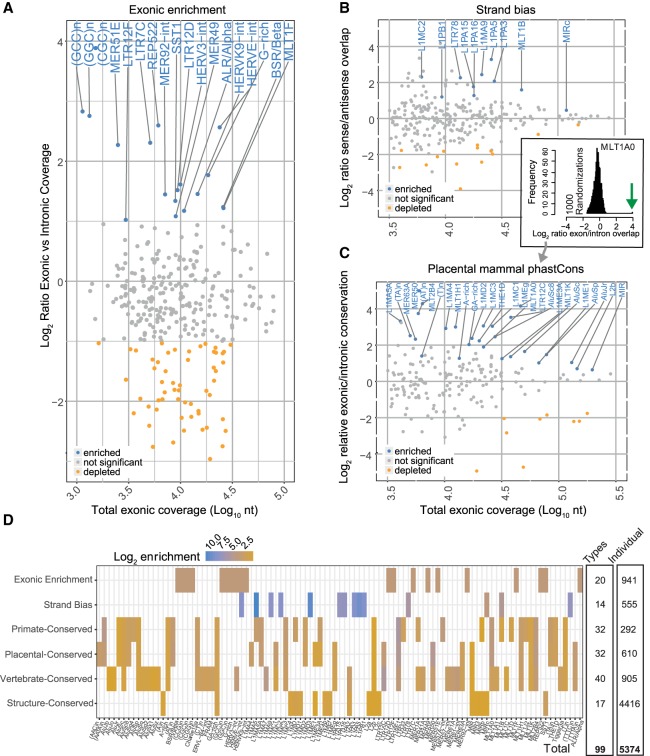
Figure 3.
Evidence for selection on TEs in lncRNA exons. (A) Figure shows, for every TE type, the enrichment of per nucleotide coverage in exons compared with introns (y-axis) and overall exonic nucleotide coverage (x-axis). Enriched TE types (at a twofold cutoff) are shown in blue. (B) As for A, but this time the y-axis records the ratio of nucleotide coverage in sense versus antisense configuration. “Sense” here is defined as sense of TE annotation relative to the overlapping exon. Similar results for lncRNA introns may be found in Supplemental Figure S1. Significantly enriched TE types are shown in blue. Statistical significance was estimated by a randomization procedure, and significance is defined at an uncorrected empirical P-value <0.001 (see Methods). (C) As for A, but here the y-axis records the ratio of per-nucleotide overlap by phastCons mammalian-conserved elements for exons versus introns. Similar results for three other measures of evolutionary conservation may be found in Supplemental Figure S1. Significantly enriched TE types are shown in blue. Statistical significance was estimated by a randomization procedure, and significance is defined at an uncorrected empirical P-value <0.001 (see Methods). An example of significance estimation is shown in the inset: The distribution shows the exonic/intronic conservation ratio for 1000 simulations. The green arrow shows the true value, in this case for MLT1A0 type. (D) Summary of TE types with evidence of exonic selection. Six distinct evidence types are shown in rows, and TE types in columns. On the right are summary statistics for (1) the number of unique TE types identified by each method and (2) the number of instances of exonic TEs from each type with appropriate selection evidence. The latter are henceforth defined as RIDLs.

