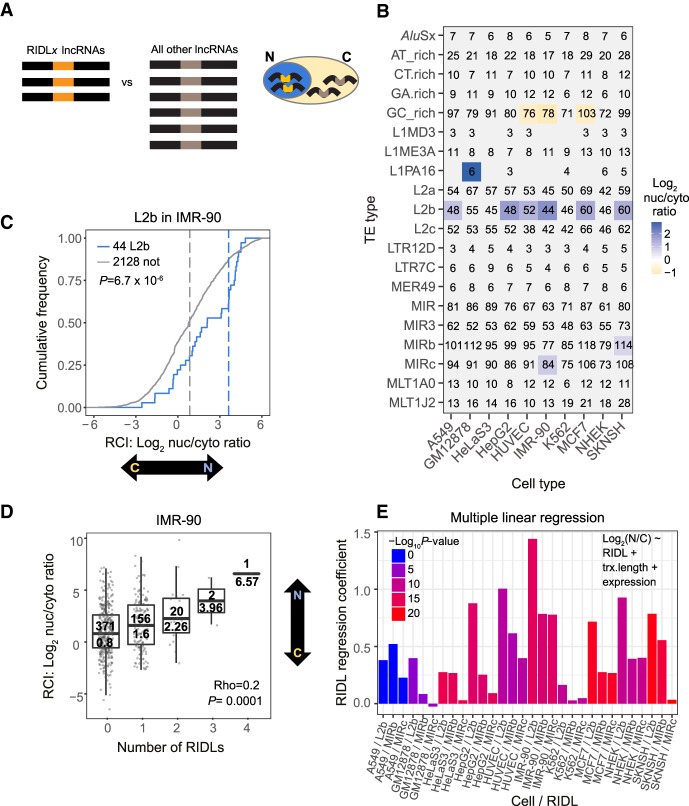
Figure 5.
Correlation between RIDLs and host lncRNA nuclear/cytoplasmic localization. (A) Outline of in silico screen for localization-regulating RIDLs. For each RIDL-type/cell-type combination, the nuclear/cytoplasmic localization of RIDL-lncRNAs is compared to all other detected lncRNAs. (B) Results of screen. (Rows) RIDL types; (columns) cell types. Significant RIDL–cell type combinations are colored (Benjamini–Hochberg corrected P-value <0.01; Wilcoxon test). Color scale indicates the nuclear/cytoplasmic ratio mean of RIDL-lncRNAs. Numbers in cells indicate the number of considered RIDL-lncRNAs. Analyses were performed using a single representative transcript isoform from each gene locus, being that with the greatest number of exons. (C) The nuclear/cytoplasmic localization of lncRNAs carrying L2b RIDLs in IMR-90 cells. Blue indicates lncRNAs carrying one or more RIDLs; gray indicates all other detected lncRNAs (not). Dashed lines represent medians. Significance was calculated using Wilcoxon test (P). (D) The nuclear/cytoplasmic ratio of lncRNAs as a function of the number of RIDLs that they carry (L1PA16, L2b, MIRb, MIRc). CC (Rho) and the corresponding P-value (P) were calculated using Spearman correlation, two-sided test. In each box, the upper value indicates the number of lncRNAs; lower value, the median. (E) Plot shows regression coefficients for the RIDL term in the indicated linear model using L2b, MIRb, and MIRc RIDLs (see Methods). Colors indicate the associated P-value. These values assess the correlation between RIDL number and nuclear/cytoplasmic localization (Log2(N/C)) of their host transcript while accounting for possible confounding factors of transcript length (trx.length) or whole-cell expression levels (expression).

