Figure 4.
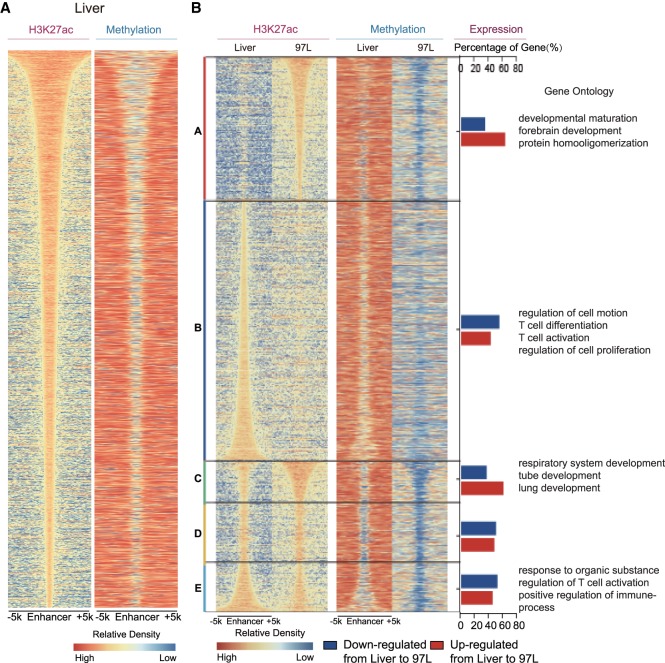
MBS is in accordance with enhancer alteration. (A) Methylation boundary shift in enhancer region. Enhancer is defined as the H3K27ac peak except those located in promoter region (TSS ±1 kb). Enhancers are arranged according to the H3K27ac peak length in Liver, and methylation level of the enhancer is shown in the same order as H3K27ac peaks. (B) General enhancer alteration including gain/loss and length variation coordinately with aberrant DNA methylation in 97L cells. A–E are classified as follows: A (97L-specific enhancer); B (Liver-specific enhancer); C (enhancer in 97L cells with width at least 500 bp more than that in Liver); D (enhancer in 97L or Liver cells extends <500 bp); and E (enhancer in Liver with width at least 500 bp more than that in 97L cells). A–E represent enhancer gain, loss, extension, no extension, and reverse extension, respectively, in 97L compared with Liver cells with corresponding aberrant DNA methylation in the right column. Percentage of up-regulated (red bar) and down-regulated genes (blue bar) is significantly correlated with enhancer altering pattern (P-value = 7.565 × 10⁻¹³, Pearson's χ2 test). Gene Ontology analyses show that genes coordinated with enhancer alteration are enriched in terms related to cell identity transformation, immune, and T cell activation.

