Figure 3.
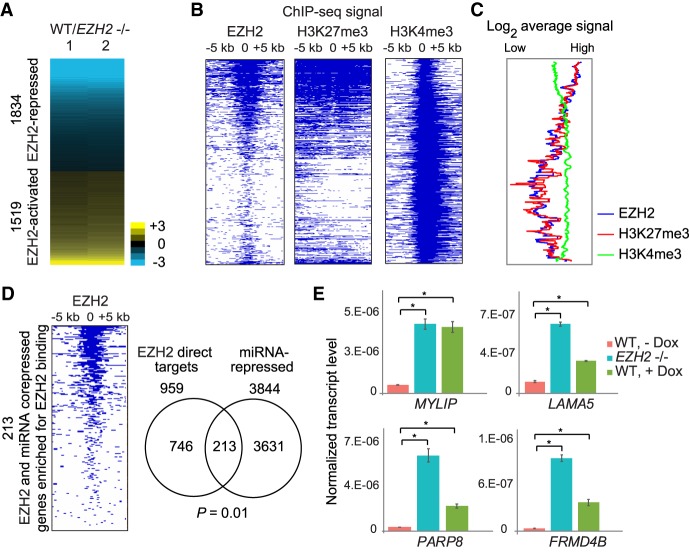
miRNAs repress hundreds of genes directly repressed by PRC2. (A) Heat map showing differential expression of protein-coding genes in response to EZH2 knockout. Genes are ranked in increasing order of log2 fold change (≤−0.5 and ≥0.5 log2 fold change) in WT/EZH2−/−. (B) Heat map showing enrichment scores (−log10 Q-value calculated using MACS2) for EZH2, H3K27me3, and H3K4me3 for genes plotted in and ordered as in A. (C) Average EZH2, H3K27me3, and H3K4me3 ChIP-seq signal for genes plotted in A. (D, left) Heat map plotted as in B for genes corepressed by EZH2 and miRNAs. (Right) Overlap between genes directly repressed by EZH2 and gene repressed by miRNAs. Significance of overlap was calculated using the hypergeometric test. (E) qRT-PCR validation of genes repressed by both EZH2 and miRNAs, plotted as in Figure 1E. (*) P < 0.05, paired t-test.

