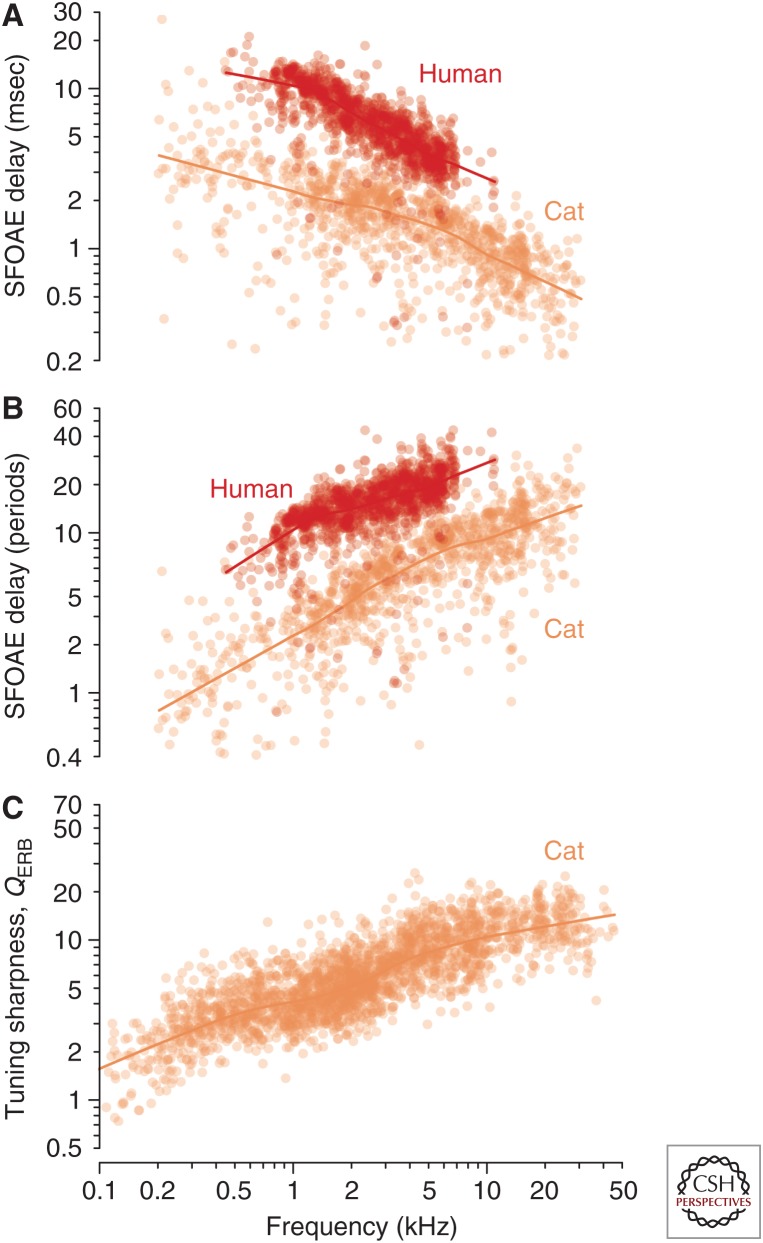
Figure 1.
Otoacoustic delays and neural tuning. Stimulus-frequency otoacoustic emission (OAE) group delay versus frequency in humans and cats. (A) The delays (in msec) are shown as scatterplots (dots) with their corresponding loess trend lines. (From Shera and Guinan 2003; adapted, with permission, from the authors.) (B) The group-delay data and trends from panel A replotted in natural units (periods of the stimulus frequency). (C) Sharpness of tuning in cat. The values of QERB and their trends were computed from auditory-nerve-fiber (ANF) tuning curves in cat using standard algorithms (e.g., Evans and Wilson, 1973). (From the laboratories of P.X. Joris, M.C. Liberman, and B. Delgutte via Joris et al. 2011; adapted and reprinted, with permission, from the authors.)

