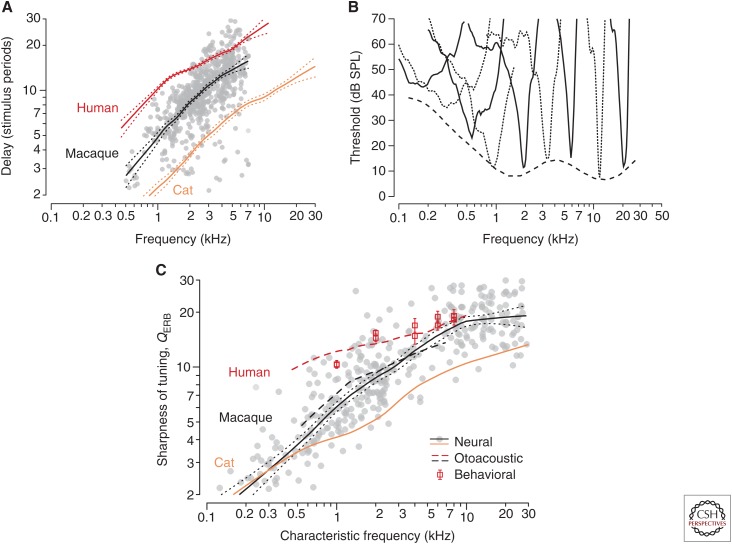
Figure 4.
Stimulus-frequency otoacoustic emission (SFOAE) delays in macaques compared with trends from other species. (A) The gray dots and trend (black line with 95% confidence intervals) show macaque group delays in natural units (NSFOAE). The blue and red lines show species trends in cats and humans (Fig. 1). (B) Example of auditory-nerve tuning curves in macaques. For clarity, tuning curves are shown using alternating solid and dashed lines. The dashed line shows the smoothed lower envelope of the neural threshold data. (C) Sharpness of tuning in macaques and other species. The gray dots and trend (black line with flanking dots delimiting 95% confidence intervals for the trend) show macaque QERB values derived from auditory-nerve-fiber tuning curves. The blue line shows the neural trend in cats. The red dashed line gives the human trend derived from SFOAE delay; the red squares and standard errors show behavioral values (Oxenham and Shera 2003). The black dashed line gives the macaque trend obtained from Equation 2 using the values of in panel A. (From Figs. 2–4 in Joris et al. 2011; adapted, with permission, from the authors.)

