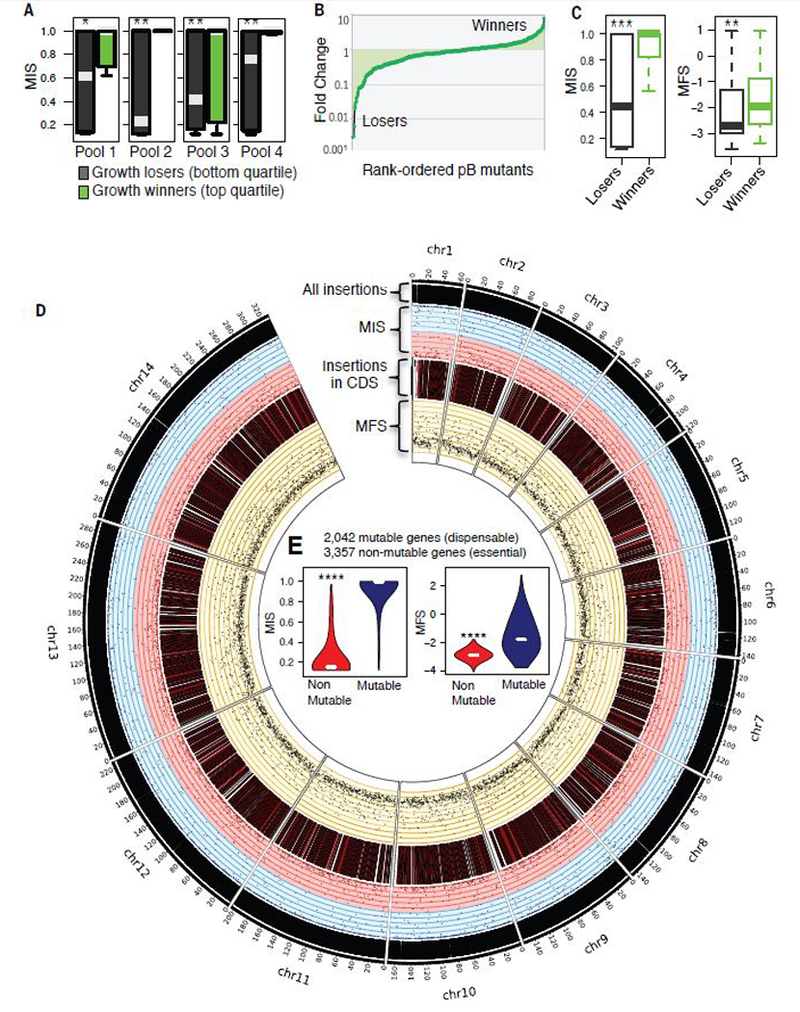
Fig. 3. Validation of mutagenesis score through phenotype screen.

(A) Competitive growth assays of asexual blood-stage growth under ideal in vitro culture conditions: phenotypes of four independent mixed-population pools grown for three cycles confirmed losers (left, bottom quantile) and winners (right, top quartile) had significantly different MIS. (B) Overall rank-ordered plot of competitive growth phenotypes shows losers and winners. (C) Competitive growth ‘losers’ had significantly lower MIS and MFS, respectively, validating MIS and MFS as predictor of gene essentiality and dispensability. (D) Circos plot from outer to inner shows the distribution of all piggyBac insertions, MIS (pink indicates MIS < 0.5, while blue is >0.5), CDS insertions, and MFS along each chromosome of P. falciparum genome. (E) Violin plots indicate non-mutable genes had significantly lower MIS and MFS (‘****’ represents Wilcoxon p < 2.2e-16).
