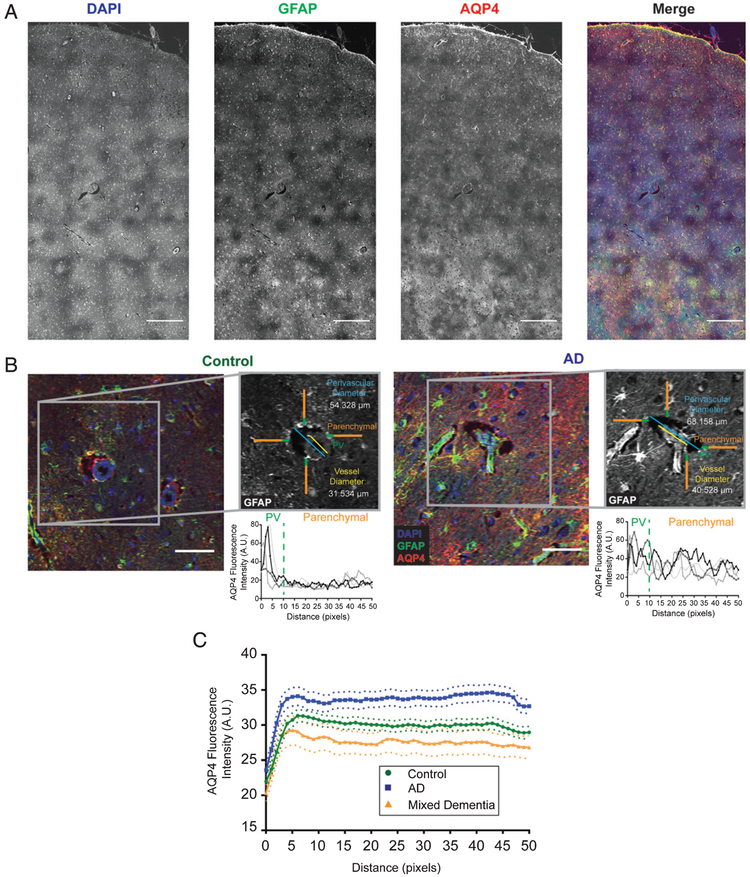
Fig. 1.
Standardized analysis of perivascular dilation and perivascular AQP4 localization. Representative image of large field images (A) as well as individual vessels (B) used for quantification. Example images are shown for both control (B, left) and Alzheimer’s disease (B, right) along with the associated methodology for analysis of the perivascular compartment (inset). Regions of interest were generated using the GFAP channel (grey), then measured using the AQP4 channel. The yellow line represents the vessel diameter measurement, while the perivascular dilation measurements is shown in blue. Orange and green lines represent the perivascular AQP4 quantifications with green representing signal defined as “perivascular” while the orange segment is the “parenchymal” signal. Plots are representative of AQP4 intensity measurements for each of the linear regions of interest. Blue =DAPI, green =GFAP, and red =AQP4. Scale bars = 500 μm (A) and 50 μm (B). C) Plots showing the average intensity along the 50 pixel linear ROIs for control (green), Alzheimer’s disease (blue), and mixed vascular and Alzheimer’s disease (orange) cases for all vessels measured. Dotted lines represent the 95% confidence intervals for each category.

