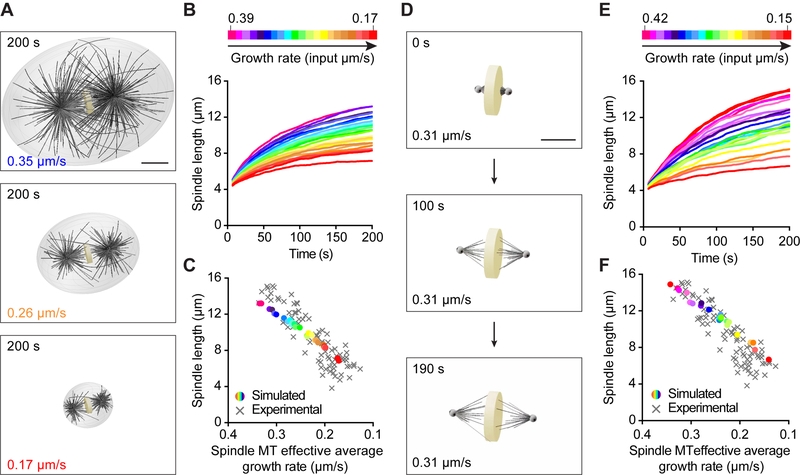
Figure 5. Microtubule Growth Rate Scales Spindle Length in Computational 3D Spindle Models.
(A) Spindle length scaling with microtubule growth rate and cell volume. Astral and spindle microtubules and a cell boundary are included in these simulations. Images correspond to steady state spindles obtained after running the simulations for 200 s. The input growth rate indicated at the bottom left of each image. Scale bar, 5 μm.
(B) Simulated spindle length plotted over time at various microtubule growth rates. Color-coding of the growth rate indicated at the top, from magenta (0.39 μm/s) to red (0.17 μm/s).
(C) Simulated steady state (200 s) spindle length plotted over the effective average spindle microtubule growth rate. Growth rate color-coded as in (B). Experimental data in grey.
(D) Spindle length scaling with microtubule growth rate. Only spindle microtubules are included in these simulations. Images correspond to a spindle obtained with a microtubule growth rate of 0.31 μm/s at the beginning of the simulation (0 s, top) and after running the simulation for 100 s (middle) and 190 s (bottom). Scale bar, 5 μm.
(E) Simulated spindle length plotted over time at various effective average spindle microtubule growth rates. Color-coding of growth rate indicated at the top, from magenta (0.42 μm/s) to red (0.15 μm/s).
(F) Simulated steady state (200 s) spindle length plotted over spindle microtubule growth rate. Growth rate color-coded as in (E). Experimental data in grey.

