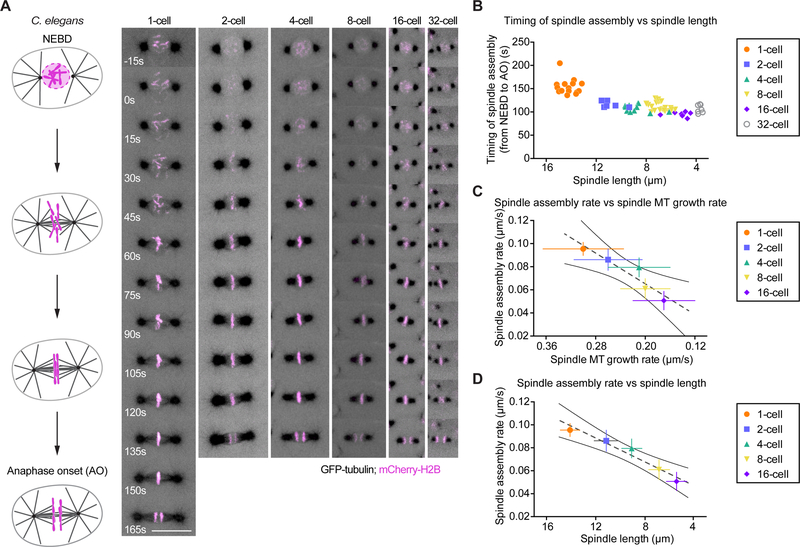
Figure 6. Spindle Assembly Rate Scales with Spindle Microtubule Growth Rate During C. elegans Embryo Cleavage.
(A) Left: Schematics of the spindle assembly process in the C. elegans embryo from NEBD (top) to anaphase onset (bottom). Right: Still frames from live confocal imaging of C. elegans embryos co-expressing mCherry-tagged Histone H2B (Magenta) and GFP-tagged β-tubulin (Grey) during spindle assembly in the first six embryonic divisions (1- to 32-cell stage from left to right). Timings are relative to NEBD. Images correspond to maximum projections of z-stacks. Scale bar, 10 μm.
(B) Spindle assembly timing measured from the 1- to the 32-cell stage in C. elegans embryos and plotted over the corresponding spindle length at anaphase onset. Each dot corresponds to an individual spindle. (n≥9 per stage).
(C) Mean spindle assembly rate (Spindle length/Spindle assembly timing) measured at each cleavage stage from the 1- to the 16-cell stage plotted over the corresponding average spindle microtubule growth rate. Dotted and solid grey lines represent the linear regression and 95% confidence interval respectively.
(D) Mean spindle assembly rate (Spindle length/Spindle assembly timing) measured at each cleavage stage from the 1- to the 16-cell stage plotted over the corresponding average spindle length. Dotted and solid grey lines represent the linear regression and 95% confidence interval respectively.

