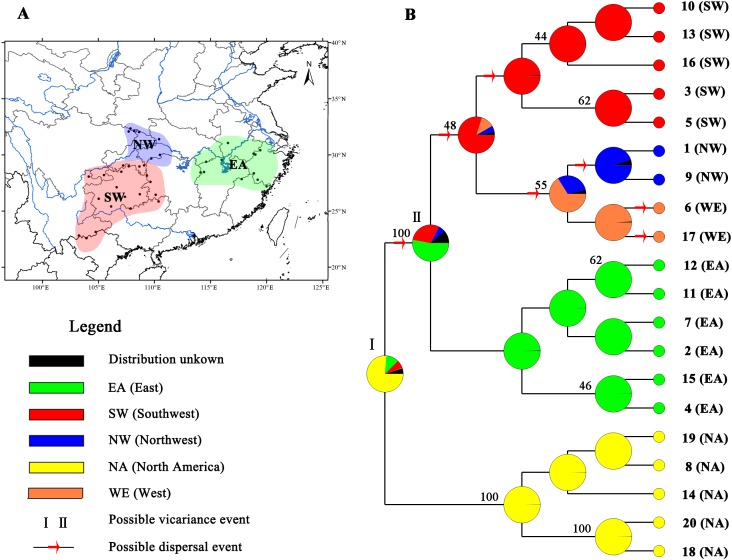
Figure 4. Ancestral area reconstructions based on the Bayesian binary Markov chain Monte Carlo (BBM) method implemented in RASP using the MP chronogram of Liriodendron chinense.
(A) The insert map shows major floristic divisions in Subtropical China. (B) Maximum parsimony (MP) tree of the 20 haplotypes detected in Liriodendron. Pie charts of each node illustrate the marginal probabilities for each alternative ancestral area derived from BBM with the maximum area number set to four. The number above the branches indicate bootstraps support value above 40. The colour key identifies possible ancestral ranges at different nodes. Possible dispersal events are indicated by red arrows.

