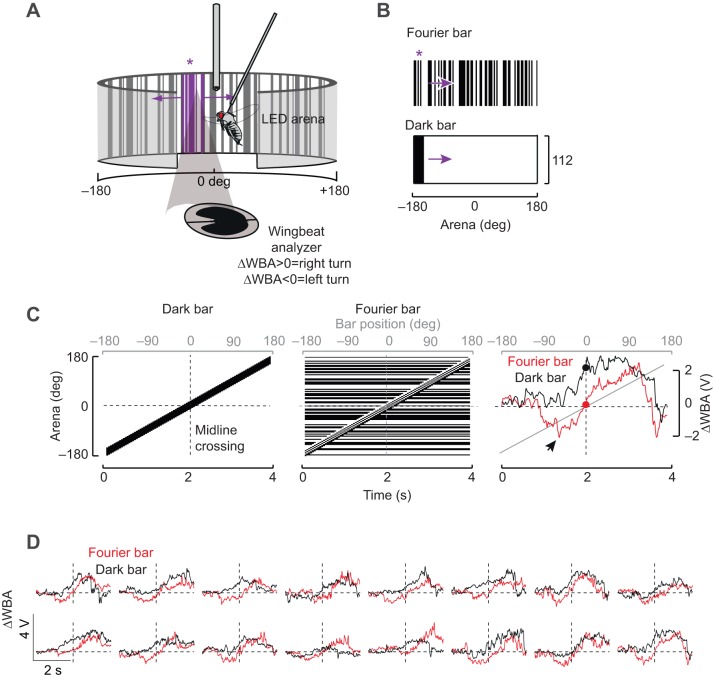
Fig. 1.
Behavioral responses to a luminance-defined dark bar and a motion-defined Fourier bar are distinct in tethered Drosophila melanogaster. (A) Schematic diagram of the visual flight simulator. A fly is tethered to a tungsten pin and surrounded by an arena of LEDs. An infrared light source above the fly casts a shadow on a photodiode that records the wing beat amplitude (WBA). (B) Fourier bar and dark bar stimuli. Purple asterisk indicates the location of the motion-defined Fourier bar (see A). (C) Left and middle: space–time plots for dark and Fourier bars shown for a full rotation around the 360 deg visual azimuth. Dashed vertical line indicates the midline crossing when the bar is directly in front of the fly. Right: ΔWBA responses of a single fly to rotation of a Fourier (red) and dark (black) bar. Red and black dots indicate the ΔWBA when the figure is at the midline. Arrowhead indicates a small saccade-like event. (D) Plots similar to those in C showing single response traces from 16 flies. The right-hand panel is the same as the right panel in C.

