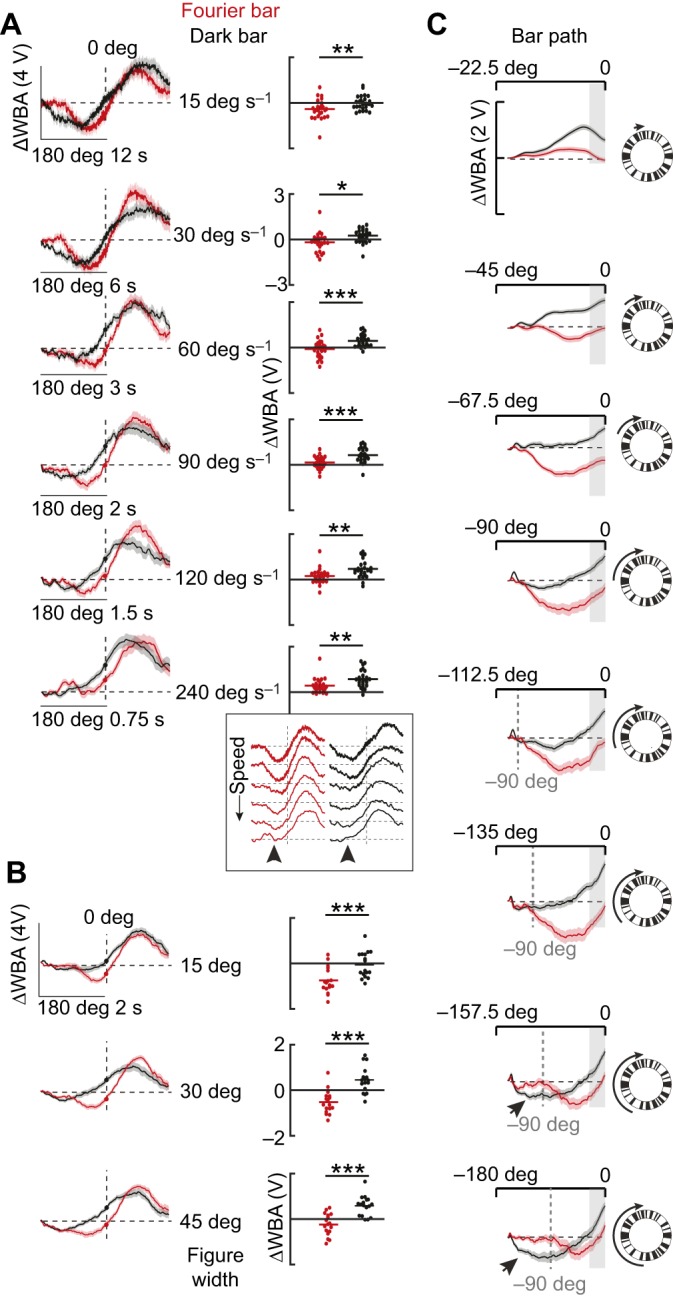
Fig. 3.

Qualitative differences between Fourier and dark bar responses persist across bar velocity, size and trajectory. (A) Left: average steering responses to a 30 deg Fourier bar (red) and a dark bar (black) revolved CW at varying speed as indicated. Shaded regions indicate s.e.m., n=26. Right: dot plots indicate ΔWBA at the midline crossing. Horizontal lines indicate mean values. Paired t-test (*P<0.05, **P<0.01, ***P<0.001). Inset: mean traces from A re-plotted to highlight the speed-dependent loss of the orientation response (arrowheads). (B) Average steering responses to bars of varying widths, as indicated, revolved CW. Shaded regions indicate s.e.m., n=17. Paired t-test (P=5.32×10⁻⁶ for 15 deg, P=1.34×10⁻⁵ for 30 deg and P=1.61×10⁻⁵ for 45 deg). (C) Average steering responses to 30 deg bars revolved starting from eight different locations along the visual azimuth and ending on the visual midline as indicated with cartoons and arrows. Shaded regions indicate s.e.m., n=37.
