Fig. 5.
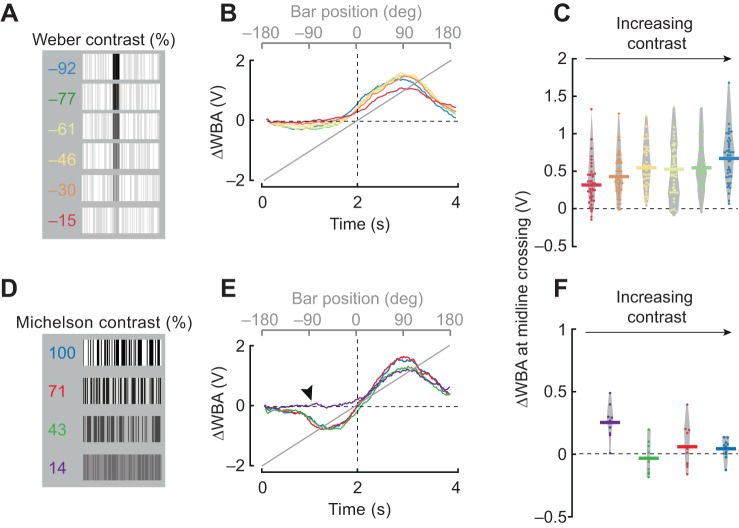
Qualitative differences between the Fourier and dark bar persist across different contrast conditions. (A) Luminance-defined bar at varying contrasts (indicated) (see Materials and Methods). (B) Mean steering responses to CW rotation of 30 deg bars. Color code is the same as in A. n=42. (C) ΔWBA values at the zero-crossing; each dot represents an individual fly. Horizontal lines represent mean values and the gray envelope encloses all data points. (D) Fourier-type bars with varying Michelson contrast as indicated. (E) Mean steering responses to 30 deg Fourier bars. Black arrowhead indicates the absence of the usual contra-directional steering response to a low-contrast Fourier bar approaching the visual midline. (F) Data presentation of mid-line crossing values from E, plotted similarly to C. n=11.

