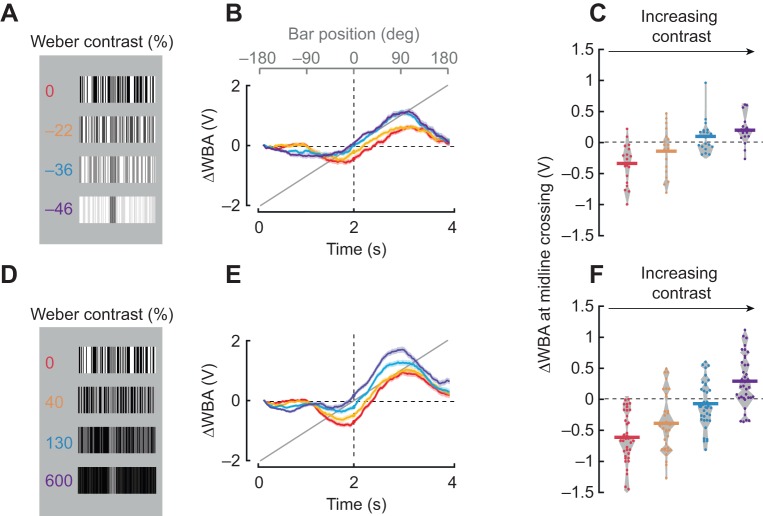
Fig. 6.
Varying luminance contrast between the bar and the background elicits phase lags to bar revolution. (A) A single Fourier-type bar of intermediate contrast tested against four different backgrounds; the luminance contrast of the bar as indicated. For the first bar, the mean luminance per unit area of the bar was matched to the mean luminance of the background (red). For subsequent bars, the background luminance was systematically increased. (B) Average steering responses to CW rotation of 30 deg bars, color coded for stimuli in A. Shaded regions indicate s.e.m., n=19. (C) ΔWBA values at the zero-crossing; each dot represents an individual fly. Horizontal lines represent mean values and the gray envelope encloses all data points. (D) The same bar used in A (red), superimposed upon the background patterns of decreasing mean luminance. (E) Average steering responses to CW rotation of 30 deg bars. Shaded regions indicate s.e.m., n=37. (F) ΔWBA values at the zero-crossing; each dot represents an individual fly. Horizontal lines represent mean values and the gray envelope encloses all data points.

