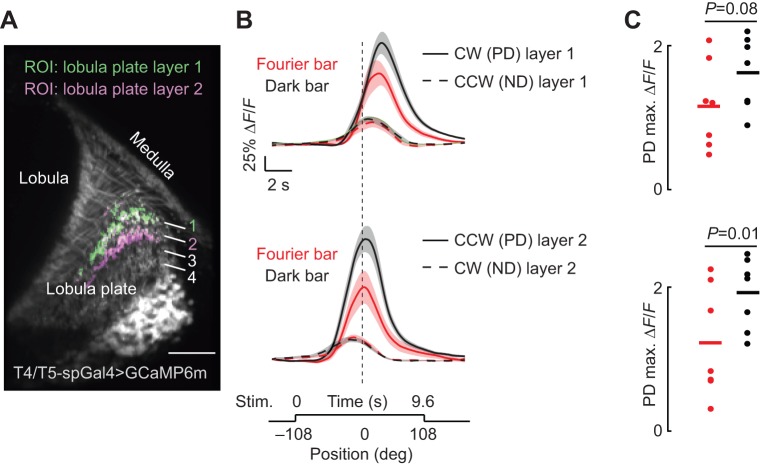
Fig. 7.
The dark bar elicits stronger preferred directional responses from T4/T5 cells than the Fourier bar. (A) Single two-photon excitation image of T4/T5 cells expressing GCaMP6m. The region of interest (ROI) was restricted to either layer 1 or layer 2 of the lobula plate as indicated. (B) Average calcium responses (ΔF/F, change in fluorescence) of T4/T5 neurons to a CW or CCW rotating Fourier (red) and dark bar (black). Each panel compares preferred direction (PD) and null direction (ND) responses in each layer as indicated. ND traces are time inverted for visual comparison with PD responses. Shaded regions indicate s.e.m., n=7. (C) Maximum calcium responses from PD data in B. Each dot represents data from an individual fly; horizontal line indicates mean responses. Paired t-test P-values comparing peak PD responses as indicated.

