Fig. 8.
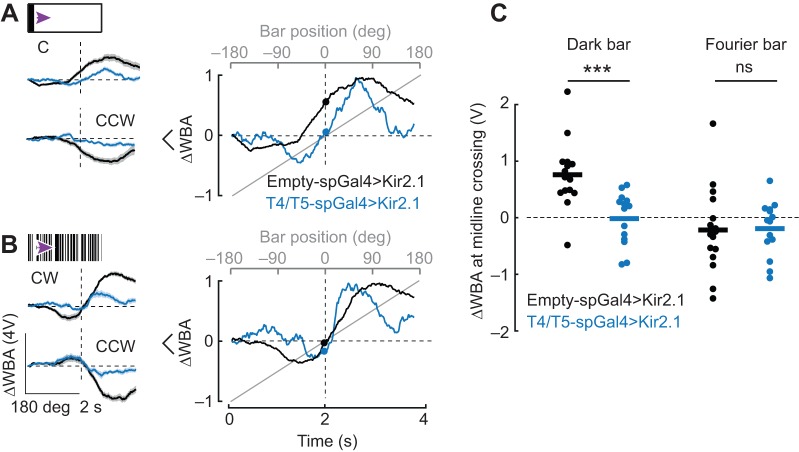
Genetically silencing T4/T5 eliminates the phase-advanced behavioral response to the dark bar. (A) Left: average steering responses to a 30 deg dark bar rotating CW or CCW in control flies (black) and T4/T5-silenced flies (blue). Shaded regions represent s.e.m. Right: average traces from the left panel normalized to their own maximum to facilitate comparison. (B) Left: average steering responses to a 30 deg rotating Fourier bar in CW and CCW directions. Shaded regions represent s.e.m. Right: average traces from left panel normalized to their own maximum to facilitate comparison. (C) ΔWBA values at bar midline crossing; each dot represents a single fly; horizontal line indicates mean. n=16 enhancerless control, n=14 experimental genotype. Wilcoxon rank sum test to compare control and T4/T5-silenced flies: P=3.2×10⁻⁴ for dark bar response at midline crossing comparing control and T4/T5-silenced flies; P=0.66 for Fourier bar. ***P<0.001.

