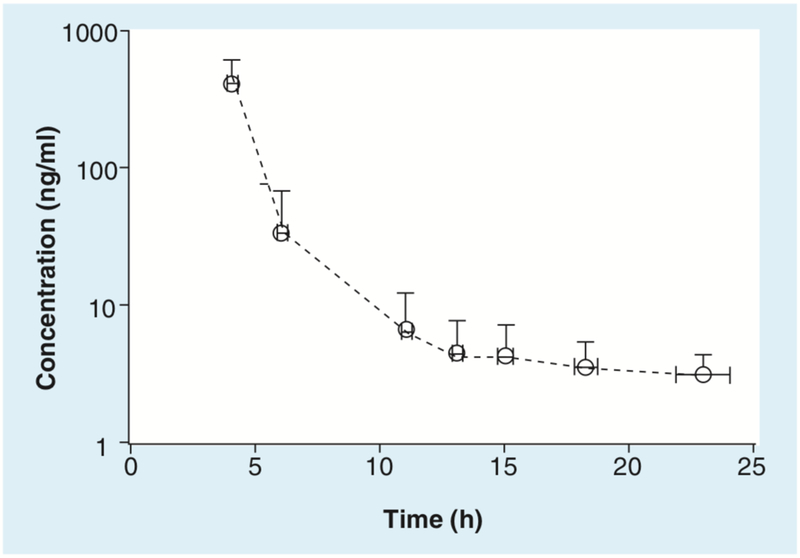
Figure 2. Mean concentration–time profile for 60 patients after receiving romidepsin 14 mg/m2 as a 4-h infusion.
Each circle represents the mean concentration of romidepsin, at the mean collection time. X and Y error bars represent the standard deviation for concentration and sample collection time, respectively.

