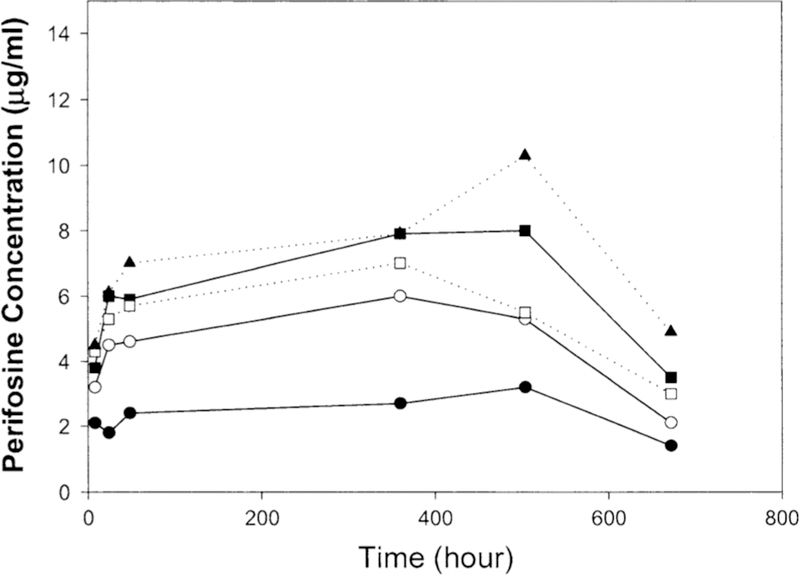
Fig. 1.
Perifosine plasma concentration–time profile. The data were from 24 patients who received perifosine from dose level l to level 5 at cycle 1. Filled circle level l (n = 3), open circle level 2 (n = 3), filled square level 3 (n = 8), open square level 4 (n = 7), filled triang le level 5 (n = 3). Median concentrations are shown

