
Figure 2.
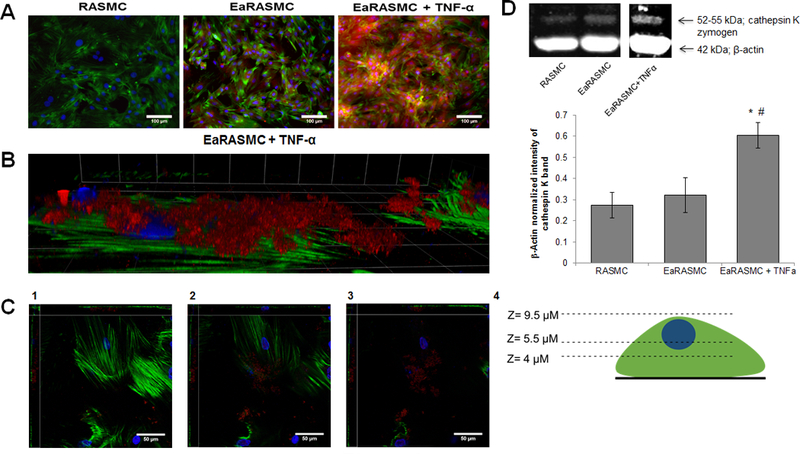
(A). IF images showing relative expression of cathepsin K by healthy, and aneurysmal SMCs, without and with TNF-α stimulation. Cathepsin K, visualized with AF-546-tagged secondary antibody, appears red while the cytoskeletal actin filaments stained with AF488 phalloidin appear green, and DAPI-stained nuclei appear blue. Scale bar: 100 μm. (B) High magnification view of EaRASMCs stimulated with TNF-α and cathepsin K visualized with AF-546-tagged secondary antibody and cytoskeletal actin stained with AF488 phalliodin. Grid: 23 μm x 23 μm. (C). Images of the EaRASMCs at different z-axis heights. (1) The bottom of the cell layer which shows minimal cathepsin K. (2) The middle of the cell layer in which cathepsin K begins to appear. (3) The top of the cells where the most cathepsin K is found. Scale bar for panels 2C1–3: 50 μm. (4) Schematic of the z-axis heights for images 2C1–3. (D). Western blot analysis for relative expression of cathepsin K by healthy, and aneurysmal SMCs, without and with TNF-α stimulation. The figure shows representative blot, indicating bands for the cathepsin K zymogen and β-actin (loading control). The plot shows β-actin normalized cathepsin K band intensity (mean ± SD; n = 3 per case; # denotes p < 0.05 compared to control RASMCs); * denotes p < 0.05 compared to TNF-α-unstimulated EaRASMCs. # indicates significance of differences versus RASMCs, deemed for p < 0.05.