Figure 8.

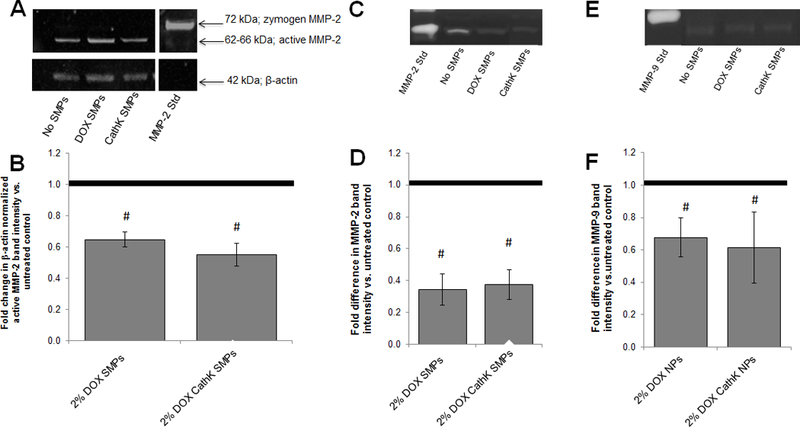
Panels 8A and 8B show effects of co-culture with unconjugated and cathepsin K antibody-conjugated DOX-SMPs on MMP-2 protein synthesis in TNF-α-activated EaRASMCs cultures, as analyzed by western blots. Panel A shows a representative blot. Panel B shows fold difference in β-actin normalized band intensity for active MMP-2 protein in DOX-SMP-treated EaRASMC layers, relative to control cultures cultured with no SMPs (mean ± SD; n = 3 cultures/condition). # indicates significant differences versus controls (assigned a value of 1.0) deemed for a p value < 0.05. Panels 8C-F show effects of co-culture with unconjugated and cathepsin K antibody-conjugated DOX-SMPs on MMP-2 and MMP-9 activity in TNF-α-activated EaRASMCs cultures, as analyzed by gel zymography. Panel C shows representative image of gel zymogram for MMP-2. Panel D shows fold difference in β-actin-normalized MMP2 band intensities compared to SMP-free control cultures (assigned value of 1.0; dotted line). Panel E shows representative gel zymogram for MMP-9. Panel F shows the fold difference in β-actin-normalized MMP9 band intensities versus SMP-free control cultures (assigned value of 1.0) Values shown indicate mean ± SD based on analysis of n = 3 cultures per condition. # denotes significance of differences versus control cultures, deemed for p < 0.05.
