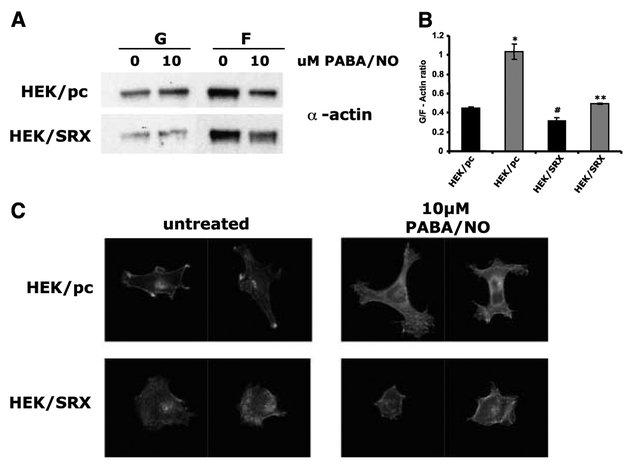
Figure 5.
Quantification of G-actin/F-actin ratio and phalloidin staining of F-actin in HEK293/pc and HEK293/SRX cells. A, representative Western blot of G-actin and F-actin from parental (HEK/pc) and Srx-overexpressing (HEK/SRX) cells either untreated (0) or treated (10) with 10 μmol/L PABA/NO for 1 hour. B, grouped densitometric data for three separate experiments expressed as the ratio of G-actin to F-actin. Black columns, untreated samples; gray columns, samples treated with 10 μmol/L PABA/NO for 1 hour. Significance difference in G-actin/F-actin ratio of HEK/pc to HEK/SRX cells (*, P < 0.01), untreated to treated HEK/pc cells (#, P < 0.05), untreated to treated HEK/SRX cells (**, P < 0.02; paired t tests). C, confocal microscope images of phalloidin-stained parental (HEK/pc) or Srx-overexpressing (HEK/SRX) cells either untreated or treated with 10 μmol/L PABA/NO for 1 hour.

